Here is a brief review of period-over-period change in short interest in the August 1-15 period in nine S&P 500 sectors.
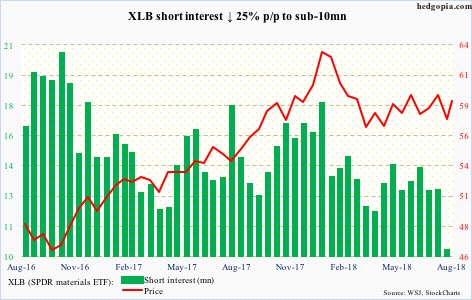
XLB ($59.13) mid-August once again successfully tested support at $57. As if anticipating this, shorts cut back big. Short interest fell 25 percent p/p to under 10 million. This virtually negates any possibility of a squeeze. The ETF is still held down by a falling trend line from late-January highs.
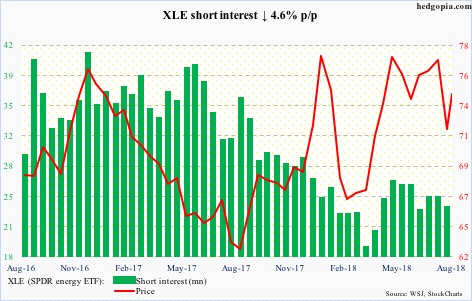
XLE ($74.54) has been under pressure since peaking at $79.42 on May 22. It has since been caught in a descending channel, the lower end of which was tested eight sessions ago, and held. The upper end gets tested around $77. But the ETF needs to first get past the 50-day moving average ($75.10).
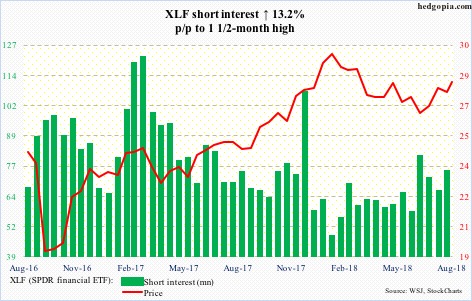
XLF ($28.24) cannot get past resistance at $28.50, with the latest rejection having come four sessions ago. As did most US stocks late January-early February, the ETF came under severe pressure, before bottoming in February. But it was not the bottom. Until late June, it kept making lower lows. Short interest has slightly built up over the past seven months, but shorts likely stay put until at least the aforementioned resistance is taken out.
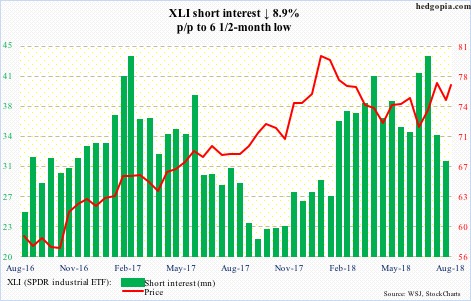
Mid-July, short interest on XLI ($76.72) rose to a 33-month high. The 28.7-percent drop since has helped the ETF. After bottoming at just south of $71 late June, it rose to $77.46 last Tuesday. There is still room for squeeze, but XLI just retreated from the top of a four-plus-month slightly rising channel.
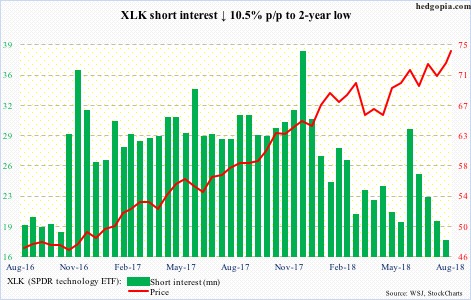
Shorts are turning tail. They have gotten squeezed – big time. Mid-December last year, short interest on XLK ($74.28) was 38 million. The latest count is 17.5 million – a two-year low. The ETF in the meantime rose to a fresh all-time high of $74.30 last Friday. Bulls are working on forging another breakout. If they succeed, unlike in the past several months, they would have done so without much help from short squeeze.
XLP (SPDR consumer staples ETF)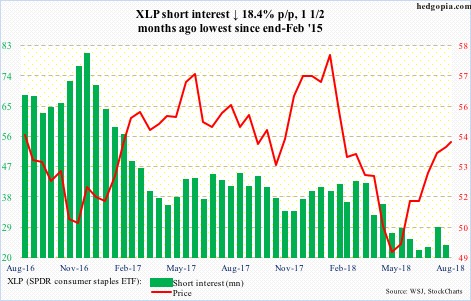
XLP ($54.06) has had quite a rally – from $48.76 early May to $55.31 last Monday. That high just fell short of strong resistance at $55.50-56. Momentum is slowing – particularly evident in weekly indicators. Nearest support lies at the 200-day ($53.49).
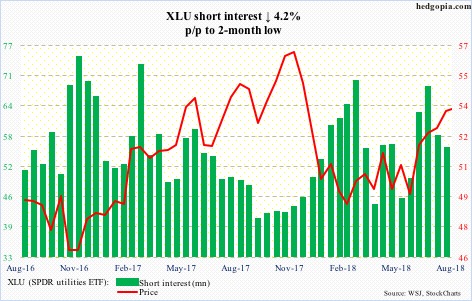
After rallying from $48.35 early June to $54.76 six sessions ago, XLU ($53.73) looks tired. Weekly momentum indicators are way overbought, and look ready to unwind. There is support at just north of $53.
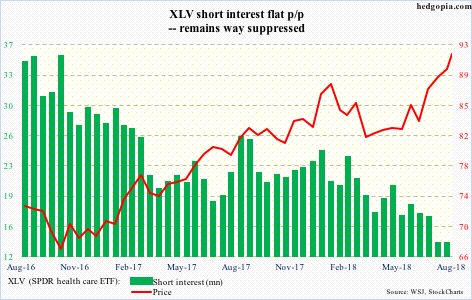
Shorts have been persistently cutting back. There is a reason why. XLV ($91.89) just rose to a new high last Friday – although barely past its prior high from late January (chart uses closing prices, hence does not reflect this well). Short interest is subdued. It remains to be seen if bulls have used up all their ammo in pushing the ETF thus far.
XLY (SPDR consumer discretionary ETF)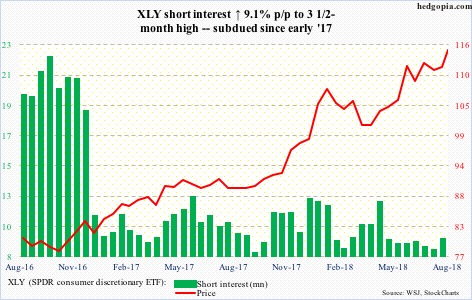
As 2017 began, shorts began to lie low. This has continued. That was smart. XLY ($114.89) has persistently rallied during the period, having just notched a fresh high last Friday, with a mini-breakout to boot. Retest takes place at $113.30s.
Thanks for reading!

