
Major US equity indices all had a positive week last week, but with a varying degree of success. The S&P 500 broke out of dual resistance with bullish marubozu on Thursday and Friday, the Russell 2000 was denied at crucial resistance on Friday with a shooting star and the Nasdaq 100 closed out the week right on crucial resistance.
After a shaky start, equity bulls came out on top in week one of the 3Q earnings season. Financials got the ball rolling, and most were sold off in the first three sessions, with XLF (Financial Select Sector SPDR Fund) drawing bids on Wednesday and rallying hard on Thursday and Friday. The S&P 500 pretty much followed the same pattern.
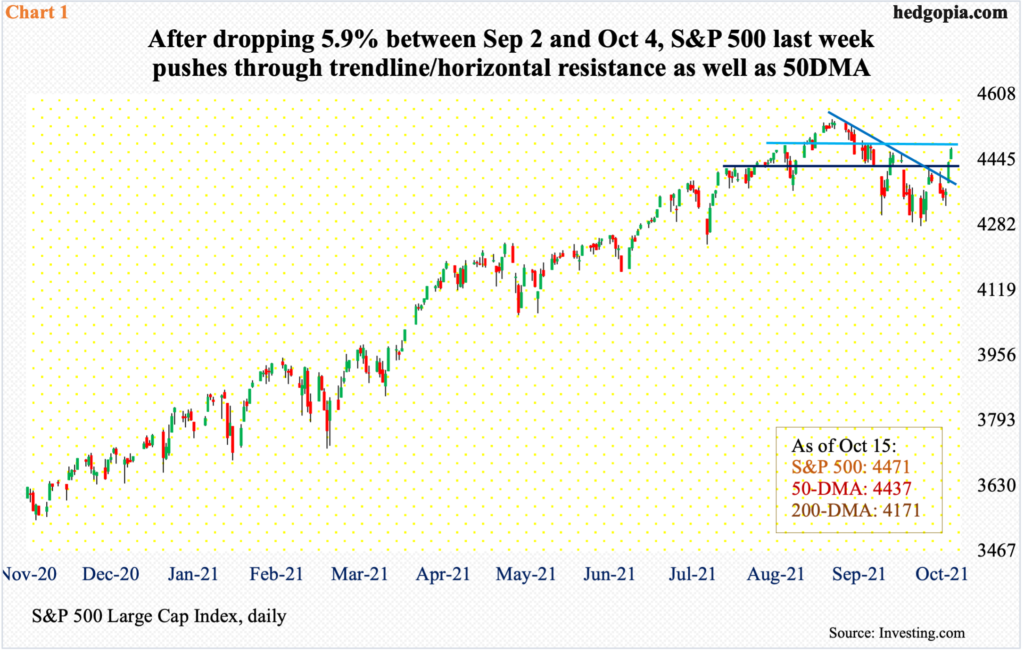
By the time the S&P 500 tagged 4330 intraday Wednesday, it was down 1.4 percent for the week. But that low was bought. By the end of the week, the large cap index erased all this and then some, finishing the week up 1.8 percent. Both Thursday and Friday gapped up to form marubozu candles (Chart 1). The 50-day was recaptured on Thursday; the index had remained under the average in 16 of the prior 19 sessions.
Ahead, there is resistance at 4480s, which is less than 10 points away, and after that lies the September 2 record high 4546. From that high through the October 4 low of 4279, the index (4471) fell 5.9 percent.
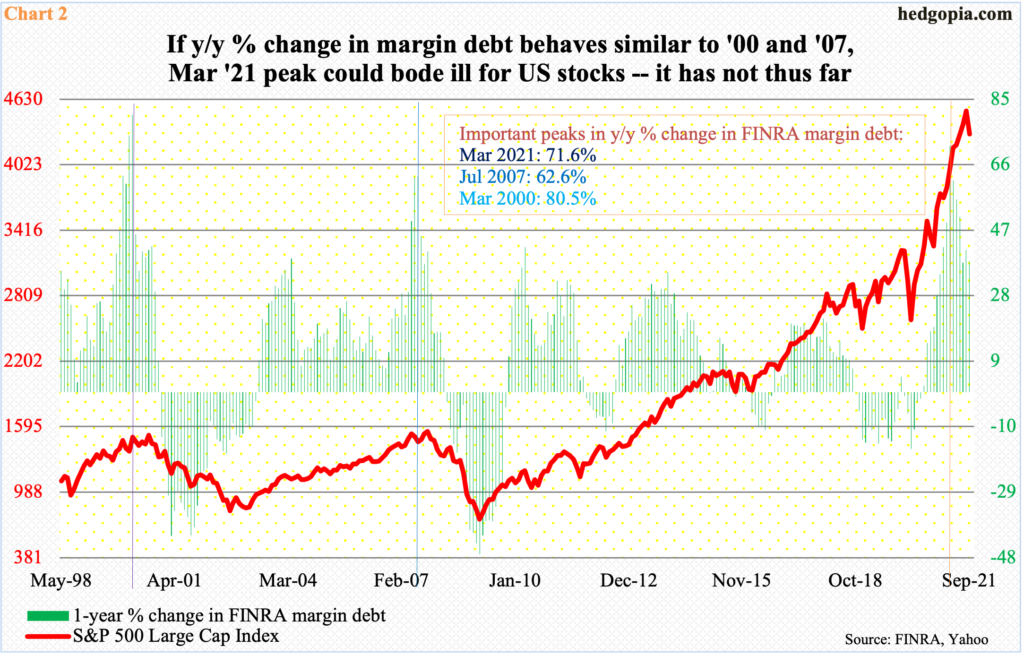
In all of September, the S&P 500 gave back 4.8 percent. This was the first down month in eight and second in 11. The September swoon was not caused by a commensurate drop in leverage. During the month, FINRA margin debt fell 0.9 percent from August’s record $911.5 billion.
From the March ’20 low through the August peak, margin debt shot up 90 percent, or $432.3 billion. The S&P 500, too, bottomed at 2192 intraday in March ’20 and through the September high surged 107 percent. The two have a very tight correlation (chart here).
Interestingly, the year-over-year change in margin debt jumped 71.6 percent in March this year before softening, with September up 38 percent. The March increase is in line with prior major peaks – 62.6 percent in July 2007 and 80.5 percent in March 2000 (Chart 2). Both those peaks either preceded or coincided with the onset of bear markets in US stocks. Thus far, this is not how things have unfolded. In fact, with October halfway through, the S&P 500 is up 3.8 percent for the month, and margin debt in all probability has cooperated.
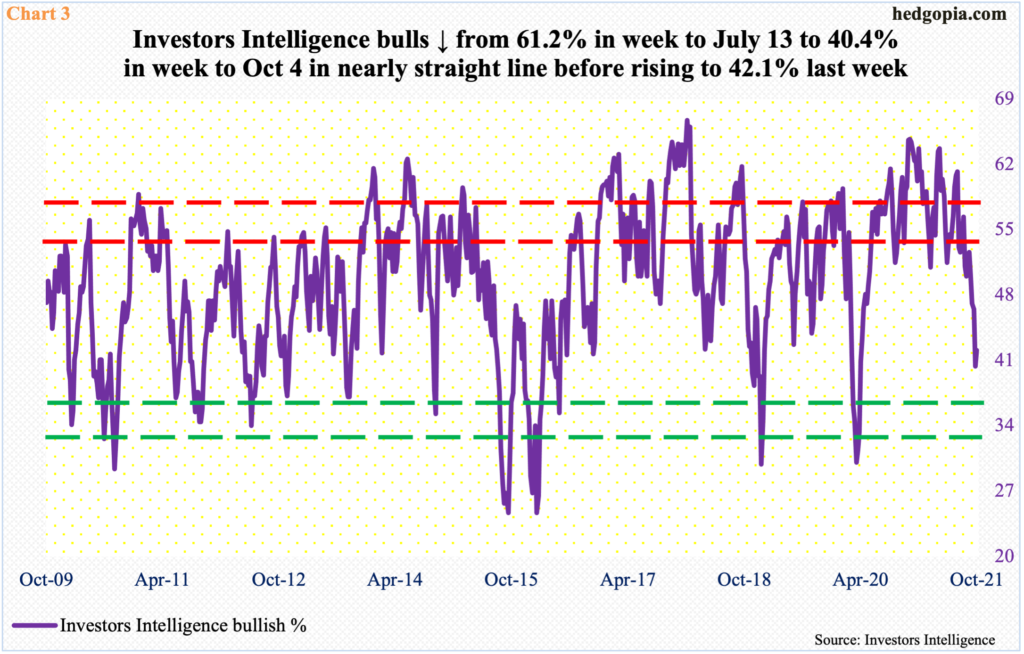
Leading up to the October 4 low in the S&P 500, investor sentiment was under pressure for weeks. In the week to July 13, Investors Intelligence bulls were 61.2 percent, which was a 12-week high.
Subsequently, in the week to September 7, which was the week the S&P 500 posted its record high, bulls were 52.6 percent. Then, their count quickly eroded to 40.4 percent in the next four weeks, that is the week to October 5. This was the lowest bullish count since April last year. Sentiment had not quite reached a buy zone but was low enough for buyers to get tempted (Chart 3). In the week to last Tuesday, bulls were 42.1 percent.
In the right circumstances for bulls, sentiment has plenty of room to recover before it reaches the red zone.
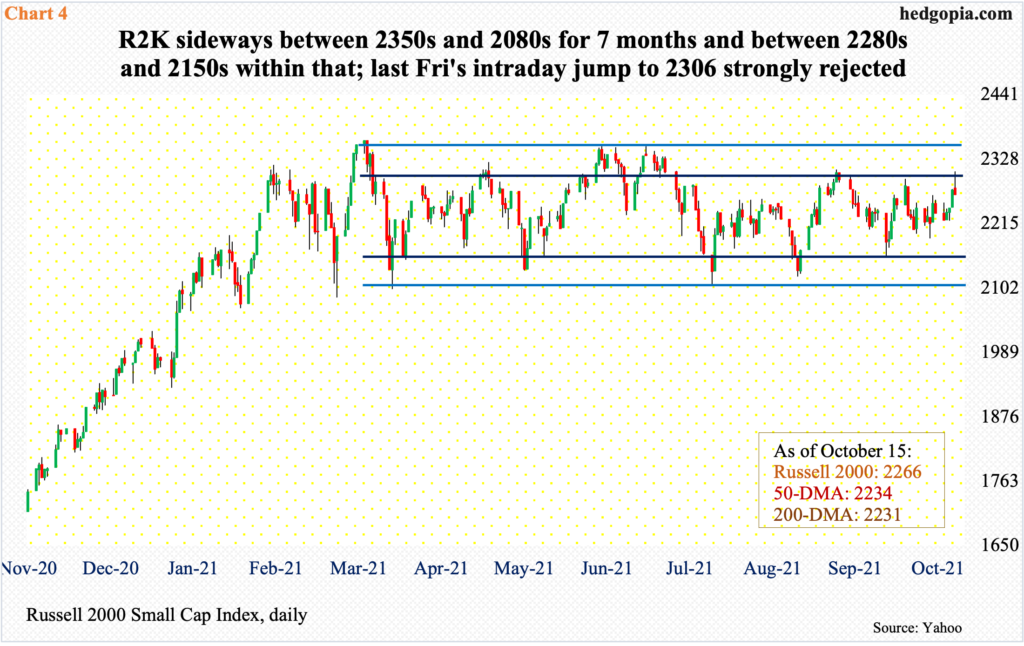
Last week’s superlative performance by large-caps was not quite matched by their smaller cousins. The Russell 2000 was up 1.5 percent and was up as much as 3.3 percent at Friday’s high. In that session, the small cap index ticked 2306 before sharply reversing lower to end the session at 2266, forming a shooting star right at resistance (Chart 4).
The Russell 2000 has been rangebound between 2350s and 2080s for seven months now. Within this rectangle lies another range between 2280s and 2150s. In essence, resistance at 2280s has acted as a roadblock for three months now, including last week; bulls have their work cut out.
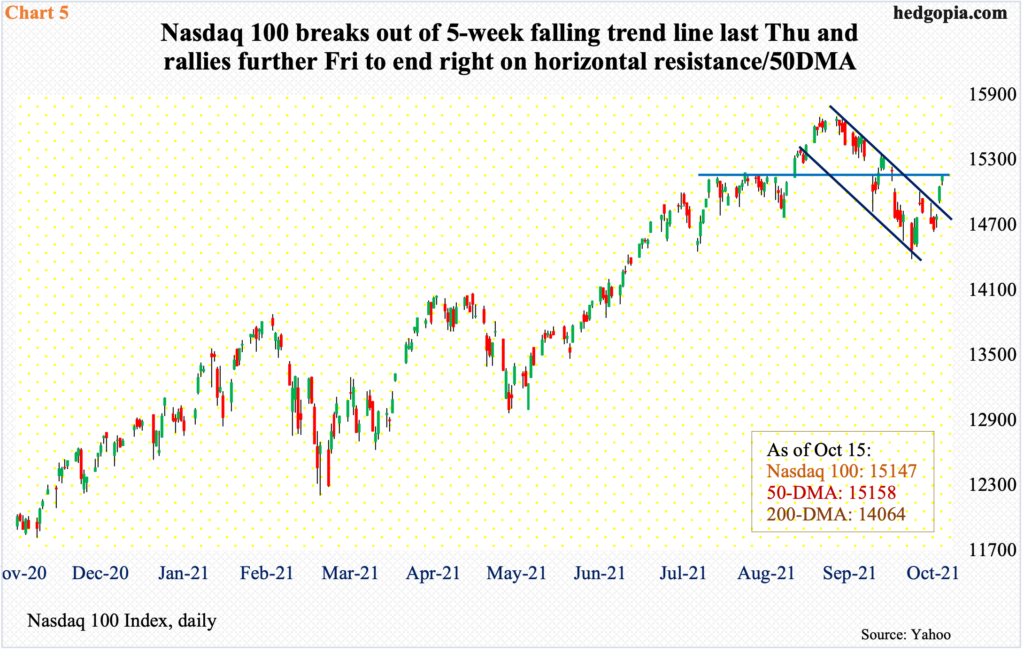
Amidst this divergence between large- and small-caps, the Nasdaq 100 last week landed right on crucial resistance.
From the September 7 record high 15701 through 14385 on October 4, the index lost 8.4 percent. Last week’s low was put in on Tuesday, followed by a rally in the next three sessions, closing out the week right on the 50-day, which also lines up with horizontal resistance at 15100s (Chart 5).
For the week, the tech-heavy index (15147) rallied 2.2 percent – back-to-back positive week, after four straight negative ones.
Bulls hope results from the leading tech outfits generate the same post-earnings reaction as did the financials. With the major banks and brokers reporting, XLF rallied 1.3 percent last week to a new high.
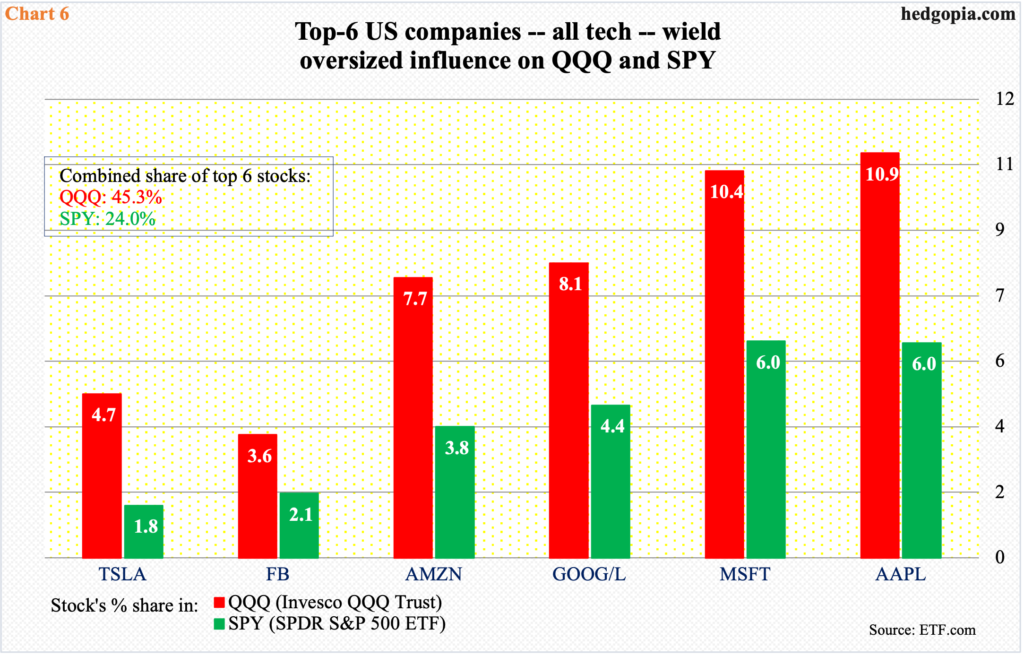
Of the top six US companies – all tech – only Tesla (TSLA) reports this week, on Wednesday. The remaining five report next week, with Facebook (FB) on Monday, Microsoft (MSFT) and Google owner Alphabet (GOOG) on Tuesday, and Apple (AAPL) and Amazon (AMZN) on Thursday.
Their results – better yet, how they are treated in markets – will matter. These companies wield too big of an influence on market cap-weighted indices not to matter. In QQQ (Invesco QQQ Trust), the top six account for 45 percent and in SPY (SPDR S&P 500 ETF) 24 percent (Chart 6).
In essence, as the generals go, so go the indices, although the fact remains that this is not necessarily always healthy. If the generals march ahead and the soldiers struggle to keep pace, odds favor the former run out of breath sooner or later.
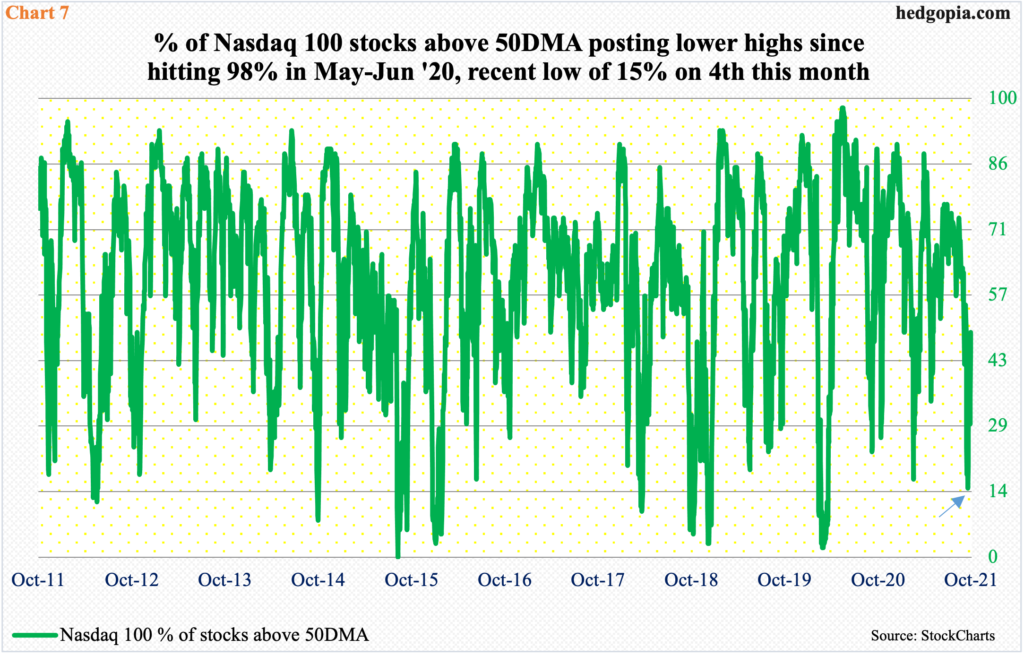
Last Friday, 45 percent of Nasdaq 100 stocks were above their 50-day, having earlier dropped to 15 percent on October 4 (arrow in Chart 7). This was low enough for a rally to ensue, and it did. There is room for the metric to continue higher, which should bode well for the index. This is a near-term outlook.
Longer term, the metric has diverged from the Nasdaq 100, in that it has made lower highs for a while now, having hit 98 percent in May-June last year. The most recent lower high of 74 percent was posted on August 30 this year.
This is a sign that markets are increasingly gravitating toward the leading companies, leaving behind the small ones. This is also borne out by how the Russell 2000 is behaving. Deep down, this is not necessarily healthy. Therefore, margin debt, as elevated as it is, needs to be watched very closely. Once those who took on debt get tempted to close out their book, the process of unwinding can last a while, and, history has shown, this has a negative correlation with equities.
Thanks for reading!
