
Both the S&P 500 and Nasdaq 100 on Monday broke out of ascending triangle but only to reverse hard lower. That said, bulls have not quite given up yet. They continue to show up at/near shorter-term moving averages. Before this large-cap wobble, the Russell 2000 failed to save its breakout retest.
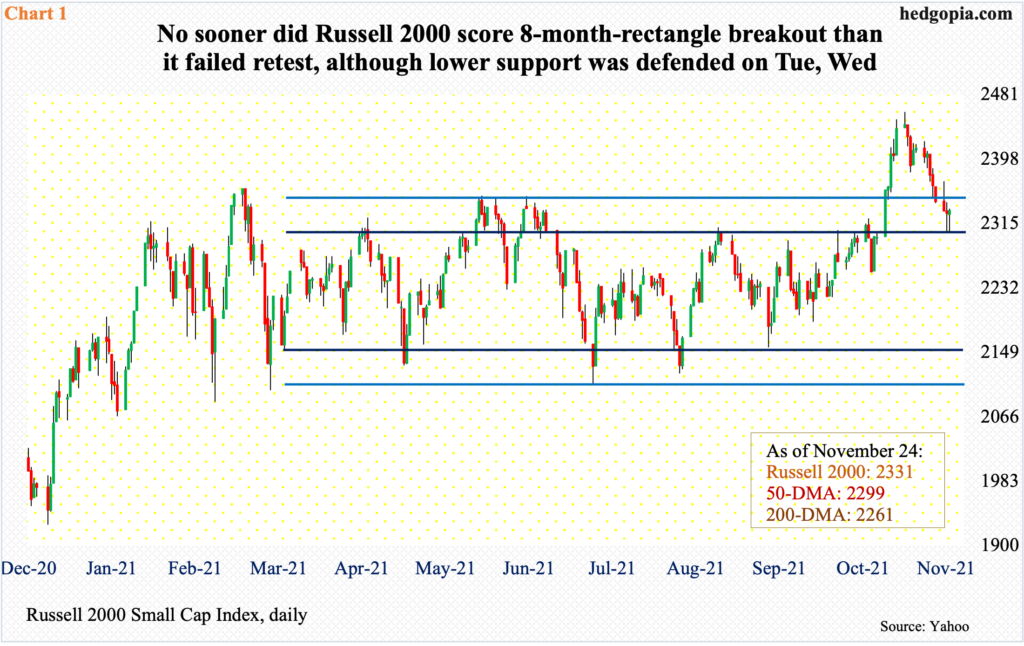
Right here and now, small-caps are not quite sending positive vibes. They are considered a risk-on barometer and typically do well in expanding economies. With this as a background, no sooner did the Russell 2000 broke out of an eight-month rectangle early this month than it failed to save a retest.
For nearly eight months, the small-cap index was rangebound between 2350s and 2080s, and between 2280s and 2150s within this box (Chart 1). On the 3rd (this month), the Russell 2000 powerfully left behind its prior high of 2360 from March this year; through that high, it surged 144 percent in a year post-March 2020 bottom.
Because the breakout three weeks ago came after eight months of consolidation, this could very well be a continuation pattern, which would mean a rally toward 2600 in due course – at least that is how technicians would view the breakout.
The rally indeed continued, tagging 2459 intraday on the 8th, but the session ended poorly with a shooting star. In the selling that followed, small-cap bulls were unable to save the retest. For consolation, on both Tuesday and Wednesday, bids showed up just above 2300, with the index closing Wednesday at 2331. This was also a successful test of the 50-day moving average.
The daily is oversold, and a rally is possible near term.
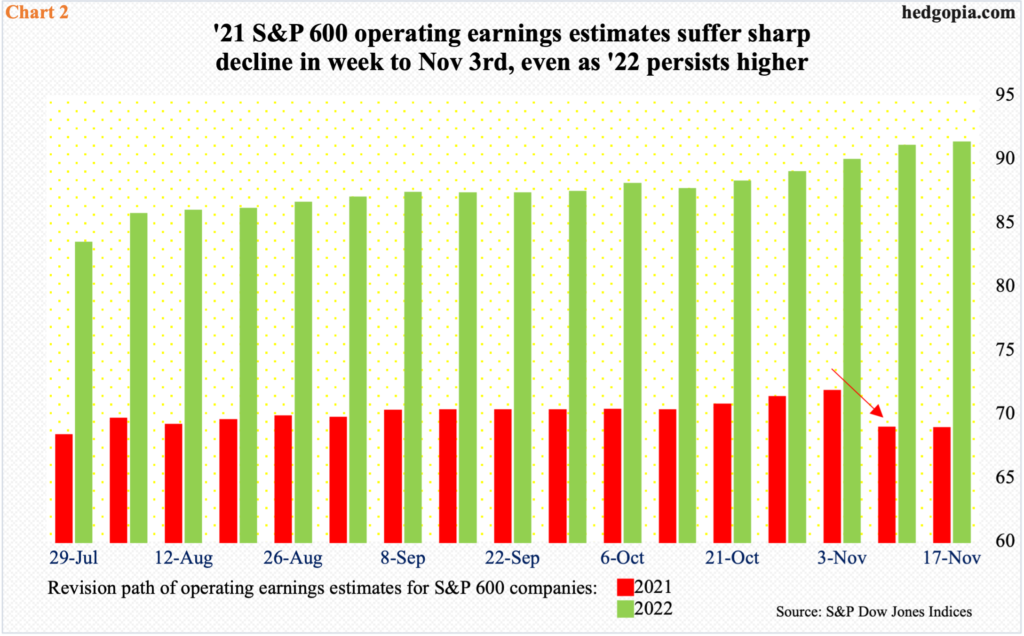
Incidentally, the 8th peak in the Russell 2000 came in a week in which 3Q21 blended operating estimates for S&P 600 companies took a sharp leg lower. In the week to November 11, estimates for the last quarter nosedived $2.71 week-over-week to $16.62, then dropping another $0.12 to $16.50 in the week to November 17. Companies are nearly done reporting the quarter, so this probably sticks.
The sharp revision downward helped pull the 2021 estimates lower $2.90 to $68.69 in the week to November 11 (arrow in Chart 2), and by another $0.04 to $68.65 in the subsequent week. Despite this, the sell-side continues to wax enthusiastic about 2022, with the latest estimate of $91.06 at a new high. If this optimism is met, earnings would have grown nearly 33 percent next year. Arguably, bulls’ inability to save the most recent breakout is casting doubt on this.
It is possible small-caps’ inability to keep the momentum going is seeping into large-caps.
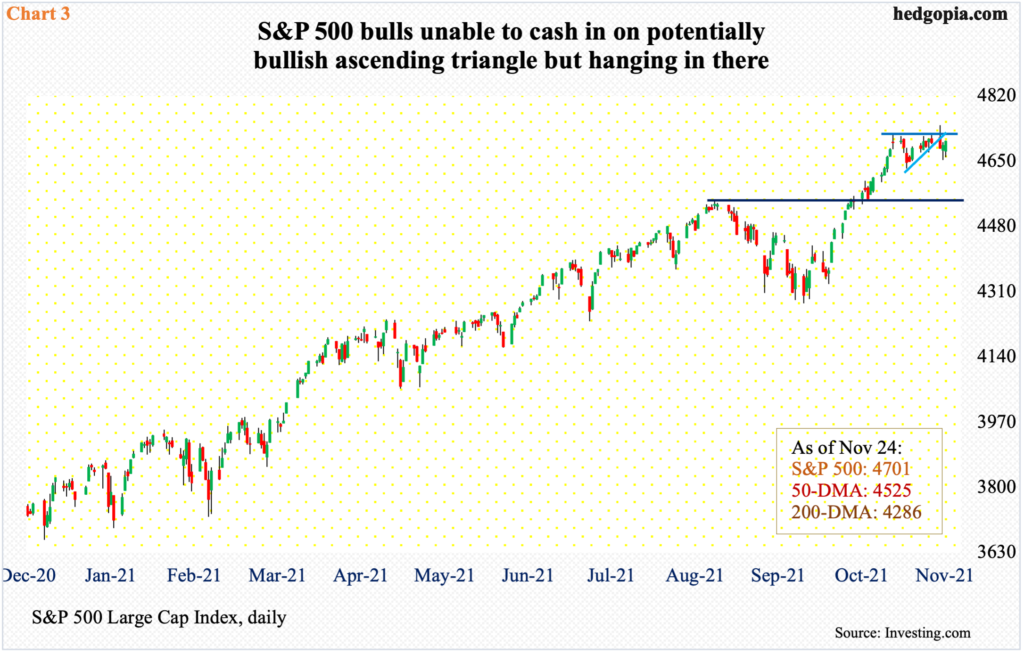
On November 5, the S&P 500 ticked 4719 to reach a new intraday high but it was posted in a spinning top session, followed by a doji. Through that high, the large cap index jumped 10 percent in a month.
It then went back and forth within an ascending triangle. On Monday (this week), the S&P 500 (4701) broke out intraday tagging 4744 but was unable to hang on to the gains reversing sharply lower, leaving behind a candle with a long upper shadow (Chart 3).
Often, ascending triangles tend to be bullish. This time around, bulls were unable to cash in on this pattern, but they have not quite given up yet. After Monday’s intraday reversal, they defended the 20-day on both Tuesday and Wednesday.
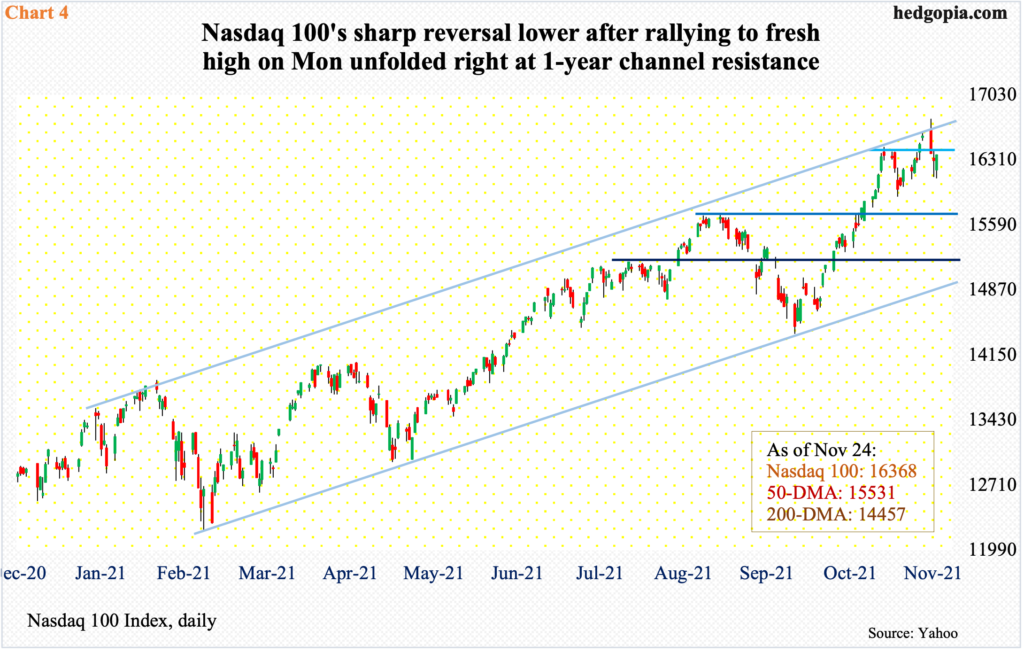
This is exactly how things unfolded on the Nasdaq 100. On Monday, the tech-heavy index rallied as high as 16765 intraday – a new high – but only to close the session lower at 16381. It turns out the reversal occurred at the top end of a one-year rising channel (Chart 4). In fact, the upper line goes back to August last year.
The index (16368) faced short-term resistance at 16400s for three weeks now, with Monday’s breakout proving transitory. On both Tuesday and Wednesday, bids showed up just under the 20-day at 16360s.
Near term, how the 10-year treasury yield behaves immediately ahead will make or mar the Nasdaq 100. Bond bears (on price) were unable to save Wednesday’s intraday rally to 1.693 percent – past the October 22 high of 1.691 percent – closing at 1.645 percent; this helped major equity indices shake off early weakness in the session. If, however, the bears regroup and the 10-year rate charges toward the March high of 1.765 percent, then tech suffers. At least that is how tech stocks have been trading of late.
This will obviously drag down the S&P 500. The top six tech companies – Apple (AAPL), Microsoft (MSFT), Google owner Alphabet (GOOG), Amazon (AMZN), Tesla (TSLA) and Facebook (FB) – play too big a role in both these indices.
Thanks for reading!
