
Equity bears have been rewarded the past couple of weeks, with the S&P 500 large cap index down 1.6 percent. There is likely more reward medium term, but near-term is a toss-up.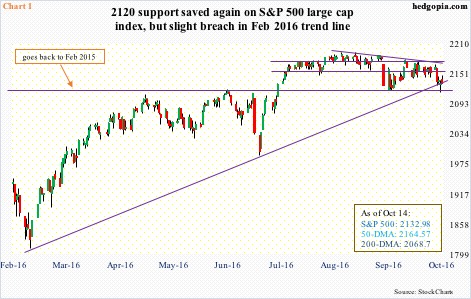
In the wake of the 2.5-percent drop on September 9 when the S&P 500 sliced through its 50-day moving average as well as lost 2175-2180, it has failed at that support-turned-resistance at least a couple of times (Chart 1). That average is now declining. Ditto with the 10- and 20-day.
Last Friday, in what could potentially be early signs of a shift in investor sentiment medium term, financials were unable to hang on to the early gains.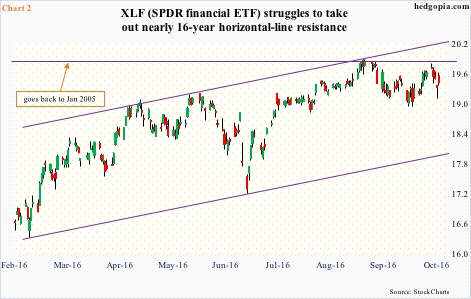
JP Morgan (JPM), Wells Fargo (WFC), Citibank (C) and PNC Financial (PNC) reported 3Q16 results pre-open. All four opened higher but closed substantially off the highs, with the first two closing in the red. At session highs, XLF, the SPDR financial ETF, was up 1.5 percent, but ended the session up 0.5 percent. Through last Monday, the ETF rallied north of 27 percent since early February this year and north of 15 percent since late June (Chart 2).
So if investors/traders have decided to lock in profit, who can blame them? Why deal with uncertainty relating to the U.S. presidential election (November 8) and the upcoming FOMC meeting (November 1-2)? It is unlikely the Fed moves in that meeting, but December (13-14) is wide open.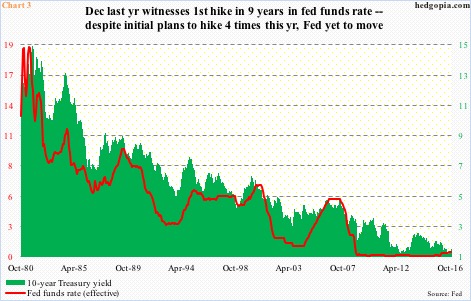
September 20-21 FOMC minutes showed several members viewed not to raise rates as a “close call.” There is a growing divide within the FOMC, but the ranks of hawks are growing, with three dissents in the September meeting. The last time they raised was last December (15-16), ending seven years of inaction. The target range for the Fed funds rate was raised in that meeting by 25 basis points to 0.25 percent to 0.5 percent – still zero-bound (Chart 3). Back then, the Fed was sounding aggressive, with plans of four more hikes this year.
Consequently, from peak to trough in three weeks between December 29 and January 20 (this year), the S&P 500 dropped from 2081.56 to 1812.29, for a drop of 13 percent. This was a way of stocks showing their displeasure at the hiking plans of a central bank that believes in the wealth effect. And it worked. The Fed softened its tone.
This could very well recur … wash, rinse and repeat.
That said, for profit-taking to follow in earnest, the bears need to be able to push major U.S. indices below crucial levels.
On the S&P 500, it is 2120, which was first reached in February last year. The index briefly rallied to 2134.72 in May that year before going sideways. This July, it broke out, rallying to a new all-time high of 2193.81 on August 15. Last week’s one-percent drop was preceded by three inside weeks.
The September 9th drop has wrought damage to the momentum. But kudos to the bulls for stepping up in defense of 2120, including last Thursday. There has been a slight breach of the February 2016 uptrend line, but barely (Chart 1).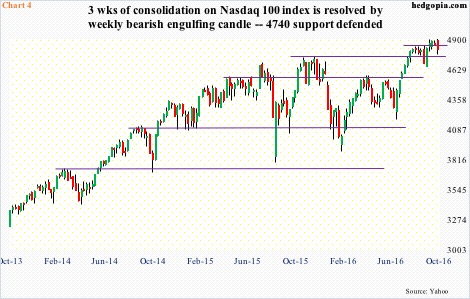
The Nasdaq 100 index similarly sits at a crucial level. The 4740 level, which goes back to November last year, has proven to be an important price point between bulls and bears. The index broke out last month, but has struggled to build on it. After three weeks of sideways move and rising to an all-time high of 4904.72 on Monday, it kind of broke down last week with a bearish engulfing candle (Chart 4).
On a weekly chart, the Nasdaq 100 seems to be on the verge of a bearish MACD crossover. Ditto with 10- and 20-day moving averages. Last Friday, it lost the 50-day moving average – albeit just by a hair’s breadth; the average is now slightly declining. Despite all this, the low last Thursday pretty much tested the afore-mentioned support – so far successfully.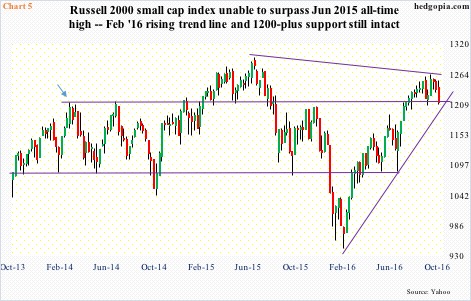
On the Russell 2000 small cap index, the September 22nd high of 1263.46 came within 2.6 percent of the June 2015 high of 1296 – in other words a lower high. Other major U.S. indices, including the Dow Industrials, have rallied to fresh all-time highs.
Back in March 2014, the Russell 2000 rallied to 1212.82 before retreating (arrow in Chart 5). That level was tested in June that year and again in December. It finally broke out in February last year, with a peak in June, followed by a sell-off into September last year and a rally in November which was again repelled by that resistance. As did other indices, the Russell 2000 broke out this July, and is testing that support again, several times since that breakout, including last Thursday. Hence its significance.
Near-term, all these three indices are oversold. A rally can ensue, if nothing else just to unwind oversold conditions. But at the same time, medium term, indices are sending out signs of fatigue. On the S&P 500, August was a doji, September what looks like a cross between a long-legged doji and a hanging man; on a monthly basis, price (up) is diverging with the RSI (down).
But why would support give way?
As noted above, one is simple profit-taking.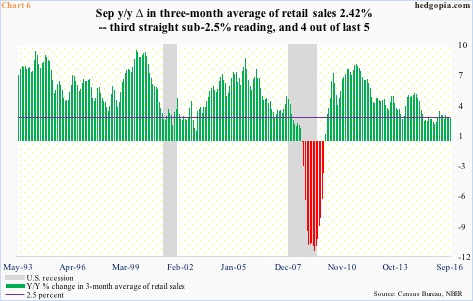
The other is if economic data start coming in weaker than expected.
A month ago, the Atlanta Fed’s GDPNow model forecasted 3Q16 real GDP growth of north of three percent. As of last Friday, this stood at 1.9 percent. (For reference, 2Q16 grew 1.4 percent, 1Q16 0.8 percent, and 4Q15 0.9 percent.) The latest downward revision owes to September’s retail sales.
Retail sales grew 0.6 percent month-over-month in September and 2.8 percent year-over-year to a seasonally adjusted annual rate of $459.8 billion. The last time sales increased at north of three percent annually was in February this year. Using a three-month average, sales grew 2.42 percent y/y – third straight month of sub-2.5 percent. As is seen in Chart 6, the 2.5 percent tends to be an important demarcation line.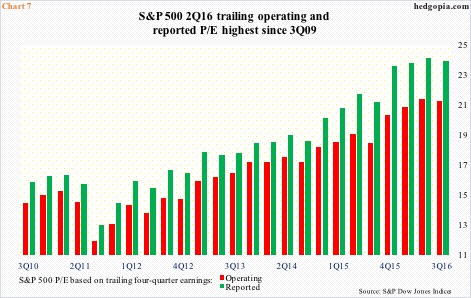
Ideally, softer economic data would mean the Fed would stand pat or not get very aggressive with its “tightening” plan … which in normal circumstances would be equity-friendly. But the problem this time around is this. Second-half earnings expectations are high – 55 percent of the consensus $110.12 in operating earnings of S&P companies is expected in the latter half. Next year, at $132.17, is much higher. These earnings need to come through, as a lot has been priced in already. On a trailing 12-month basis, the S&P 500 already trades at 21x operating earnings.
Hence the significance of 2120 on the S&P 500, 4740 on the Nasdaq 100, and 1210 on the Russell 2000. A break would be a tell as to which way investors are beginning to lean.
Thanks for reading!
