
Major U.S. indices are struggling at major resistance.
Here are the levels indices were aiming to take out: Dow Industrials, 17000-plus; S&P 500, 1990; Nasdaq 100, 4350; Dow Transports, 7700; and Russell 2000, 1080, among others.
The Industrials sought to break out on Monday, the S&P 500 Friday last week as well as Monday and Wednesday this week, the Transports last Friday and Monday, the Nasdaq 100 last Friday, and the Russell 2000 last Friday through Tuesday. All unsuccessfully.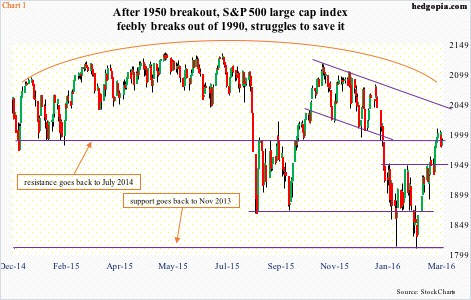
Come Tuesday, long, solid red candles showed up on all of them. That said, indices are still within spitting distance. The S&P 500 (1989.26) rose slightly on Wednesday to be literally sitting on that resistance.
In hindsight, given how overbought momentum indicators were on a daily chart, indices’ struggle is not all that surprising. But one could have made the same argument several percentage points earlier.
Off the February 11th low, they all rallied big.
From that low through the intra-day high this week, the Russell 2000 rallied north of 16 percent, the Dow Transports nearly 14 percent, the Nasdaq 100 index north of 11.5 percent, the S&P 500 large cap index 11 percent (Chart 1), and the Dow Industrials north of 10 percent.
Unless things reverse in the next few sessions, rejection at major resistance would be an important development at this juncture.
If the indices proceed to unwind overbought conditions, the best the bulls can hope for is for support to hold on the way down… and that money begins to flow into stocks.
Earlier, all these indices successfully broke out of minor resistance, but it failed to attract new money.
Focusing on the S&P 500, it broke out on March 1st. In the week ended March 2nd, $2.4 billion came out of U.S.-based equity funds (courtesy of Lipper). Stocks began to rally on February 11th. Since the week ended February 10th, north of $12 billion has been withdrawn. Longs are using the rally to exit/lighten up.
Funds are available no doubt, but they are not moving into stocks. The S&P 500 peaked last May, and money-market fund assets have been rising since.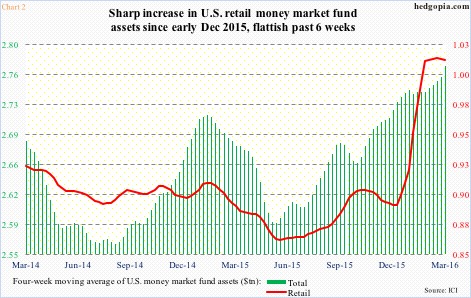
Chart 2 calculates a four-week moving average of these funds, and the latest tally reached $2.8 trillion. The green bars represent the total count, and the red line retail. Three months ago, the latter began a parabolic rise, but is no longer rising – rather sideways the past six weeks. Bulls hope the red line ultimately begins to drop, and the available funds move into stocks, helping save support.
Support (breakout retest and 50-DMA, respectively) include: S&P 500 (1950 and 1934); Russell 2000 (1035 and 1036); Dow Transports (7360 and 7128); Nasdaq 100 (4270 and 4245); and Dow Industrials (16500 and 16497).
Incidentally, except for the Transports, where the 50-DMA is flattish, the average is once again pointing lower on the rest.
A breakdown – of a lack thereof – probably decides if this was merely a pause that refreshed or the one-month rally (off that February 11th low) was taking place within a bear market.
Jeff Gundlach, of DoubleLine Capital, just made a cogent argument on his latest webcast on Tuesday that it was the latter, saying stocks have two percent of upside but 20 percent of downside.
As described in the Monday post, if the S&P 500 rallies up to 2040, it potentially faces massive reversal at that November 2015 declining trend line (Chart 1). A failure would help complete the massive rounding top already in motion.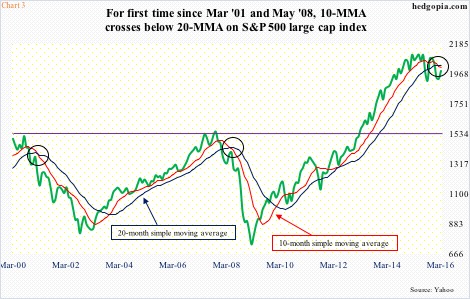
In this scenario, the bearish development seen in Chart 3 is worth paying attention to. This January was the first time since the March 2009 generational low on the S&P 500 that the 10-month moving average crossed below that of 20-month. This does not happen very often. The last two occasions were May 2008 and March 2001.
Also notice the horizontal line drawn on Chart 3, corresponding to 2000 and 2007 peaks – natural support. This is where Mr. Gundlach’s 20 percent downside risk resides.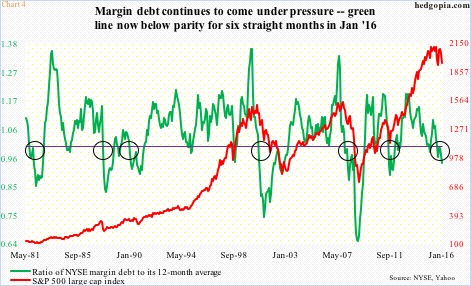
In this scenario, the green line in Chart 4 has more to go on the downside. Already, rather ominously, it has remained below parity for the last six months through January. All it does is take a ratio between NYSE margin debt and its 12-month average. Margin debt dropping below its 12-month average indicates decelerating momentum.
In January, margin debt was $447.7 billion, versus $507.2 billion last April. This particular source of buying power is running dry – not conducive for stocks.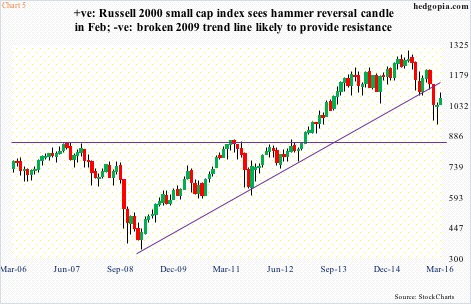
Not especially for an index like the Russell 2000 which is trying to repair the damage wrought on it during the January sell-off. Back then, it lost the 2009 trend line. As things stand now, even if the index were to break out of 1080 and march upward, the underside of that broken trend line will probably be difficult to conquer. If so, that is a bear market behavior – Mr. Gundlach’s point.
Increasingly, risk/reward dynamics are swinging in favor of shorts.
Thanks for reading!
