
Equity indices have been under pressure in the past month. They have reached important support. Which way it goes from here likely gets decided in the next several sessions.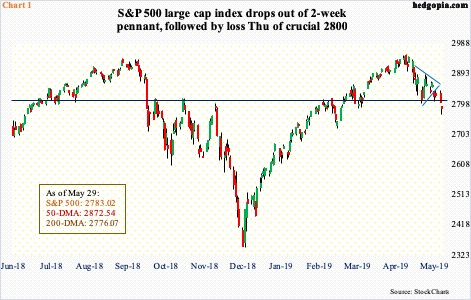
Major US equity indices continue to get beat up, even as they approach – or are slightly past – crucial support. Medium term, momentum is still down, with room for continued unwinding of overbought weekly indicators. Near term, bulls have an opportunity to step up.
No sooner did indices rise to fresh highs early this month than they began to sell off. After a month of weakness, they have reached crucial levels.
The Nasdaq 100 index (7216.86) is clinging on to support at 7200. Wednesday, a doji showed up just above the 200-day moving average (7253.86). The Russell 2000 small cap index (1489.95) has lost both its 50- and 200-day and acts the weakest of the major indices; there is decent support at 1450s. The Dow Industrials (25126.41), too, has lost both these averages and is sitting at support at 25000. The S&P 500 large cap index (2783.02) Wednesday successfully tested the 200-day, but not before losing 2800, which was being watched closely. Before this, last Thursday, it fell out of a two-week-old pennant (Chart 1).
If bulls manage to put their foot down, immediately ahead, the levels to watch include 2800 on the S&P 500, 7350 on the Nasdaq 100, 25300 on the Dow and 1505 on the Russell 2000. All these price points are within striking distance and, if reclaimed, can potentially swing near-term momentum in bulls’ favor – that is, if they can deliver.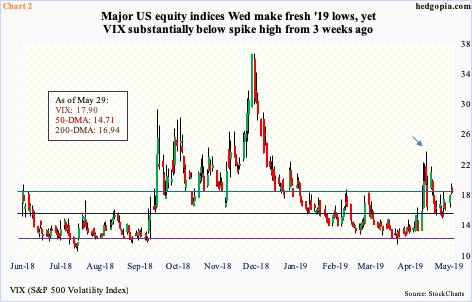
Bulls perhaps can take solace in the fact that on Wednesday all these indices dropped to fresh lows of the year, yet volatility is acting much calmer than three weeks ago when VIX shot up to a four-month high (arrow in Chart 2). Since then, it dropped to 14.42 Wednesday last week and found support at the 50-day.
Wednesday (this week), the S&P 500 lost 2800, but VIX was not reflecting panic. Hence the significance of the levels mentioned above on each of these indices. The sooner, for instance, bulls are able to recapture 2800 on the S&P 500, the better their odds near term of testing the 50-day (2872.54). The average has flattened out and could be in the process of rolling over. Once again, this is a medium-term risk for equity bulls.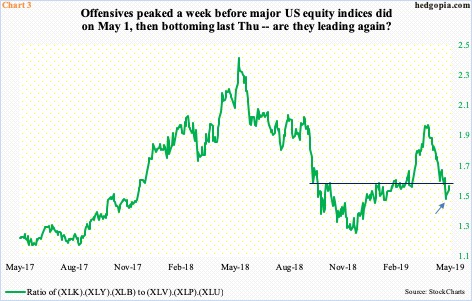
Particularly on the Nasdaq 100 and the Dow Industrials, horizontal support mentioned above has not been breached. The S&P 500 lost 2800, albeit barely. Bulls’ positioning suggests they do not expect a breach – at least near term.
Chart 3 uses six SPDR sector ETFs to create a ratio between offensives and defensives. XLK (technology), XLY (consumer discretionary) and XLB (materials) are categorized under the former and XLV (health care), XLP (consumer staples) and XLU (utilities) under the latter. Stocks peaked as soon as May began. The retreat was led by offensive sectors. The ratio peaked on April 23 at 1.924. Last Thursday, it bottomed at 1.435 (arrow), with Wednesday (this week) at 1.515, just underneath seven-month support-turned-resistance. Bulls surely hope the ratio once again is leading. A lack thereof opens up the possibility of either the indices continue to weaken or shorts show up at the aforementioned resistance. In this scenario, volatility bulls likely will have their eyes set on at least low-20s on VIX. In all likelihood, the path of least resistance gets decided in the next several sessions.
Thanks for reading!
