Last Friday sent shivers down U.S. equity bulls’ spine. Sort of. The rout in tech stocks in particular was unsettling.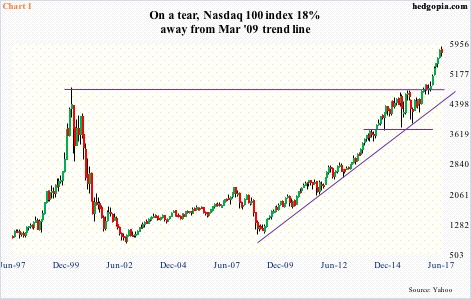
After rising to a new all-time high of 5897.69, the Nasdaq 100 index lost 2.4 percent Friday. Intraday, it was down as much as 3.9 percent. Volume was heavy. This was not just retail getting out, rather had institutional footprint.
On Monday, the index just about tested the 50-day moving average.
Friday’s daily candle has an ominous look to it, but does it look as bad in a larger scheme of things?
Thus far, support at 5450 has not been tested. Off the low in February last year through last week’s high, the index rallied nearly 52 percent, and north of 21 percent this year alone. Digestion of these gains would make perfect sense.
And perhaps most importantly for the bulls, the March 2009 rising trend line is intact. This will not be tested until 4700. This is where the index broke out of last August (Chart 1). The index can drop 18 percent, defend the support in question and still be fine.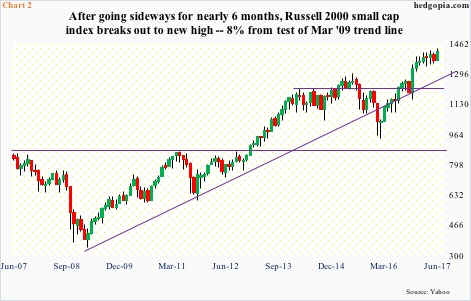
This also holds true with the Russell 2000 small cap index and the S&P 500 large cap index.
As a matter of fact, the Russell 2000 rose 0.4 percent last Friday. This was preceded one day earlier by a break out of a six-month range between 1340s and 1390s.
Throughout those six months, small-caps lagged their larger-cap brethren, during which the Russell 2000 has had two false breakouts – one in February and the other in April. Thus, it is too soon to declare the current breakout is genuine.
That said, it, too, is yet to test the trend line from March 2009 (Chart 2), which will not occur until the index drops eight-plus percent to 1300.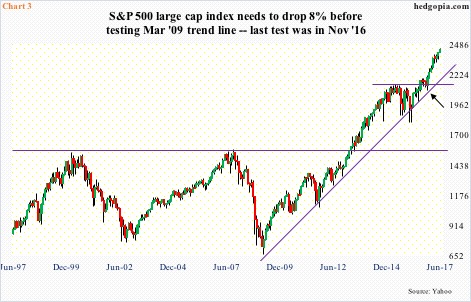
The S&P 500 is no different in this respect.
Last Friday, the index rose to a new all-time high of 2446.2, before reversing and closing down 0.1 percent; it was down 0.7 percent at the lows. The buy-the-dip mentality still prevails. Less than three weeks ago, bulls forced a break out of three-month resistance at 2400.
Longer-term, the last time the trend line from March 2009 was tested was November last year (arrow in Chart 3), and will not be tested again until the index drops eight-plus percent to 2240.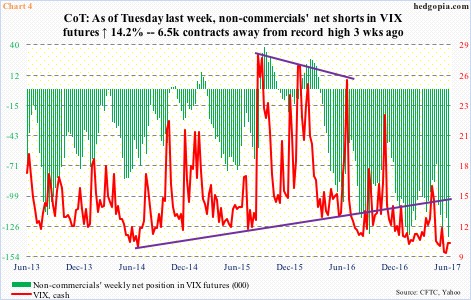
This essentially equates to an eight-percent cushion on the S&P 500, so to speak. Nonetheless, a successful test in and of itself does not ensure a newer high.
Even more important, what if the trend line gives way? It will some day. And that will be the time Charts 4 and 5 have the potential to become a real headache for the bulls.
Last Friday, spot VIX reached an intraday low of 9.37 – the lowest since the all-time low 8.89 in December 1993. Betting against volatility has persistently paid off, attracting more and more shorts.
As of Tuesday last week, non-commercials had amassed 135,853 net shorts in VIX futures. Three weeks ago, they were net short record 142,360 contracts (Chart 4). At some point, this will reverse, squeezing the shorts and putting upward pressure on VIX.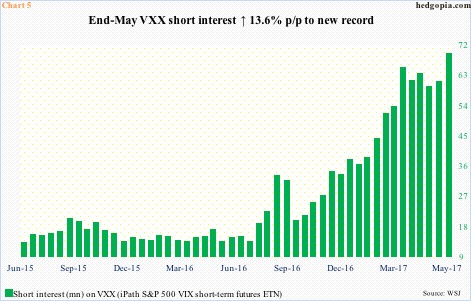
Chart 5 is the same way. End-May short interest on VXX (iPath S&P 500 VIX short-term futures ETN) stood at 68.8 million – a record. Since last October, it has had a parabolic ascent. This is potential fuel for a squeeze – timing notwithstanding.
The question is, what will trigger one?
If the afore-mentioned March 2009 trend line is convincingly violated, that for sure has the potential to set one off. Any chance one occurs before that?
As stated above, on the S&P 500, the trend line will not be tested before it drops eight percent. The last time the index corrected five percent was in early November last year. In the meantime, multiples have continued to expand, and there is nothing concrete yet as regards to Trump-promised infrastructure spending, tax cuts and regulatory relief. Hence it is not crazy to think of a scenario in which even a decent correction acts as a self-fulfilling prophecy as regards to both Charts 4 and 5.
Thanks for reading! Please share.

