
September was a down month, but it turns out the selloff was used as an opportunity to buy. Use of leverage grew last month. This was then followed this month by improved price action in small-caps, which investors tend to gravitate to when they are bullish domestic economy. Amidst this risk-on behavior, bulls will have a wider smile to their face should the ratio of Russell 2000 to the S&P 500 break out.
September was a tough month for equity bulls. After rallying hard post-March bottom, major US equity indices were sold hard. This was the first down month in six and came after a massive rally. Intraday, from the March bottom to the September peak, the S&P 500 shot up 63.7 percent.
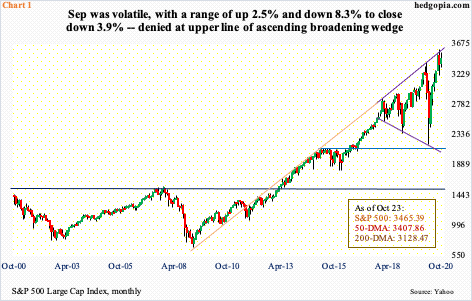
The large cap index gave back 3.9 percent in September but vacillated in a wide range of up 2.5 percent to down 8.3 percent. Nonetheless, bulls could draw solace in the fact that they were able to successfully defend crucial support.
On September 24th, the index tagged 3209.45, which was down 10.6 percent from the high and which slightly undercut support at 3220s but only intraday; by close, the horizontal support was saved. By the end of the month, bulls also recaptured the 50-day moving average, which the S&P 500 (3465.39) remained under for eight sessions.
Longer-term, bulls are probably not happy where bears showed up. The September 2nd high of 3588.11 kissed the upper line of an ascending broadening wedge, which also lines up with a trend line from the March 2009 trough (Chart 1). Back in March this year, the February-March selling stopped right at the lower line of the wedge.
Despite this, for now, they should like the fact that 3220s is intact.
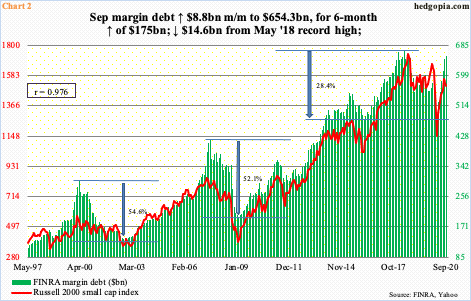
Interestingly, last month’s selling was used as an opportunity to buy. That is the impression one gets considering longs were willing to take on leverage – and by default risk. FINRA margin debt in September rose $8.8 billion month-over-month to $654.3 billion (Chart 2). This was the sixth m/m increase in a row after margin debt dropped to $479.3 billion in March – a four-year low.
Despite the recent momentum in margin debt, it remains $14.6 billion below the May 2018 record high of $668.9 billion. But a new high is possible this month. With five sessions to go, October has been a positive month for stocks. Month-to-date, the Russell 2000 is up 8.8 percent and the small cap index has tight correlation with margin debt. Going back to January 1997, it has a correlation coefficient of 0.976, versus 0.926 for the S&P 500 and 0.871 for the Nasdaq 100.
In fact, both margin debt and the Russell 2000 peaked in 2018 – the former in May and the latter in August. The other two indices mentioned above have diverged, with both persistently making new highs.
In conjunction with investor willingness to take on margin debt in September – a down month – small-cap stocks are perking up a bit.
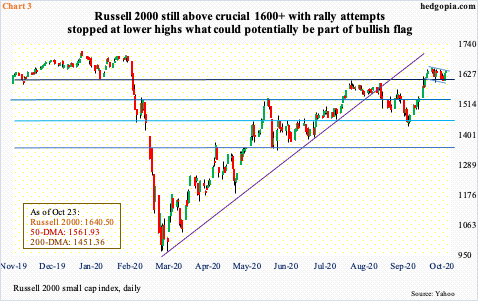
Going back to January 2018, bulls and bears have repeatedly fought over control of 1600-plus on the Russell 2000. Small-cap bulls last lost this level in late February this year. After the index bottomed at 960s in March, the rally that followed stopped on August 11th at 1603.60. Bulls then regrouped at 1450s, before launching another assault at that resistance. Two weeks ago, it fell (Chart 3).
That said, no sooner than a breakout occurred than bulls are having to fend off bears not willing to give in that easy. Shortly after the breakout, on the 12th the Russell 2000 (1640.50) tagged 1652.04. Since then, rally attempts have stopped at lower highs. This is a small victory for bears, but at the same time bulls can boast of a successful breakout retest. Plus, it is possible a flag is forming, which is potentially bullish.

The recent improvement in small-cap price action comes against the backdrop of an upward revision trend in operating earnings estimates for S&P 600 companies.
First of all, to get some perspective, 2020 estimates were as elevated as $67.63 in February last year and $56.49 at the end of last year. They began collapsing in March, dipping into negative territory in the third week of June. By September 24th, these companies were expected to lose $8.35 this year, which has since improved to a loss of $6.17. Earnings will still contract this year but will do so less than what was expected a month ago.
Next year is similar. In February this year, the sell-side was expecting $64.96 in operating earnings, before the knives came out. By mid-July, estimates were revised down to $42.99. As of last Thursday, these analysts now expect $50.23 (Chart 4).
Here is the irony in all this.
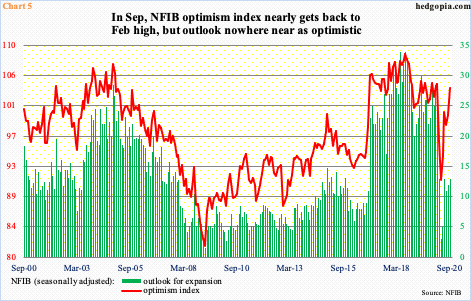
The sell-side is showing tremendous optimism for next year. Concurrently, the NFIB Optimism Index rose 3.8 points month-over-month in September to 104. This is now up 13.1 points from the April low. Three of the last four months have come in north of 100.
Small businesses are quite optimistic – except for this. Their outlook for expansion remains subdued. In January, the sub-index was 28 and 26 in February, before the bottom fell out. In April, it collapsed to three. The metric has since recovered to 13, but the improvement pales in comparison to the recovery in overall optimism (Chart 5).
The point is, it is hard to conclude what is going on. Yes, the earnings revision trend has improved, but small businesses are still hesitant to have an expansionary outlook. This is probably why the Russell 2000 has broken out, but it is far from decisive (Chart 3).
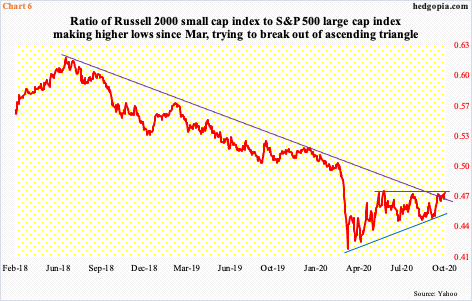
And this is probably why the Russell 2000 has broken out on its own but relative to the S&P 500 is right at resistance. The ratio of the Russell 2000 to the S&P 500 bottomed at 0.413 on March 18th. Since that low, it has made higher lows, but rallies have stopped at 0.473s, including last Friday, resulting in an ascending triangle (Chart 6).
Should a breakout occur, it will be a sign those believing in sustained recovery in the domestic economy are growing in numbers, which should then also begin to get reflected in the NFIB outlook for expansion and eventually the Russell 2000 itself. In this scenario, the only question is if the ratio breaks out now or later. In the latter scenario, it retreats here, finds support at that rising trend line and then busts through.
Thanks for reading!
