
The FOMC meets this week. No change in expected. But in the remaining four scheduled meetings, markets have priced in at least two cuts. The Fed has a juggling act in hand. The unemployment rate is near a six-decade low, and stocks are near record highs. Would the bank oblige market expectations? Better yet, should it?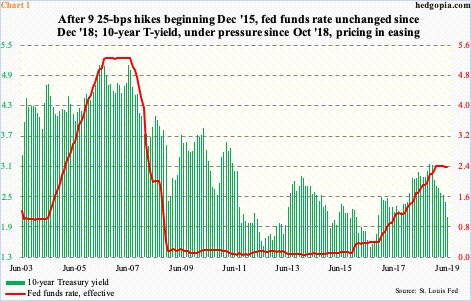
Tuesday, the FOMC begins a two-day meeting. No change is expected. Since last December’s 25-basis-point increase, the fed funds rate has remained unchanged at 225 to 250 basis points. This preceded nine hikes totaling 225 basis points beginning December 2015.
Over the past several months, rate expectations have done a 360. Last year, the dot plot expected two more hikes this year. The selloff in stocks during October-December last year forced several FOMC members, including Chair Jerome Powell, to change their tune. Early this year, the Fed made it clear there would be no hike this year. Odds are the next move would be lower – substantially so if markets are right.
After this week’s meeting, four more meetings are scheduled this year. Fed funds futures currently price in a 25-basis-point cut each in July and September, with December a toss-up. This is aggressive. Will the Fed oblige?
First and foremost, their monetary quiver does not have enough arrows. At 240 basis points, the Fed funds rate is barely above the inflation rate. But at the same time, the long end of the Treasury yield curve continues lower. The 10-year rate peaked at 3.25 percent last October and ended last Friday at 2.09 percent. Bond vigilantes do not share the hunky-dory attitude shared by many about the economy. In fact, the spread between 10-year notes and three-month bills has inverted.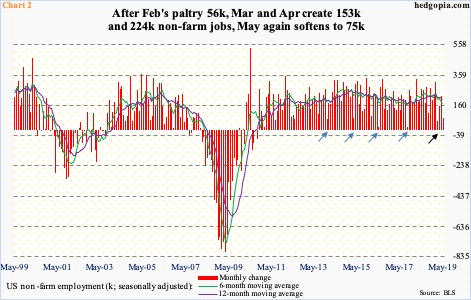
The economy is sending mixed messages, including the week ended last Friday – one showing sharp deceleration in job creation in May and the other showing retail sales hanging in there in that same month.
Job creation disappointed in May. Only 75,000 non-farm jobs were added, for a monthly average this year of 164,000, versus 223,000 last year. The hiring pace has softened. May was the second sub-100,000 month this year, with February having created 56,000 jobs (black arrow in Chart 2). Several times in the past in the current cycle, there have been one-month anomalies but only to shoot right back up in the subsequent months – 67,000 in December 2013, 77,000 in March 2015, 15,000 in May 2016 and 18,000 in September 2017 (blue arrows). This time around, the weakness has persisted. In eight of the last nine months, the six-month average has slid under the 12-month.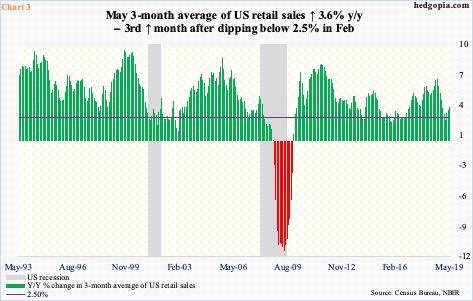
This is one side of the macro coin. On the other side, the unemployment rate in May inched up to 3.62 percent; April’s 3.58 percent was the lowest since December 1969. Wage growth has been subdued this cycle, although in the 12 months to May, private-sector wages rose 3.1 percent to $27.83. This was the 10th consecutive month in which wages grew at three percent or higher (last September was 2.98 percent).
Also in May, retail sales rose 0.6 percent month-over-month and 3.2 percent year-over-year to a seasonally adjusted annual rate of $519 billion – a new high. Chart 3 uses a three-month average, and on that basis, sales rose 3.6 percent y/y; sales have decelerated from last August’s 6.4-percent pace, but May’s was a six-month high.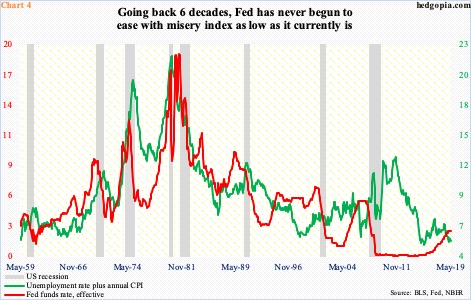
The Fed has a dual mandate – maximum employment and price stability. When it was in a tightening mode, it had the luxury of focusing on jobs. Post-Great Recession, 20.1 million non-farm jobs have been added. Inflation, however, remains subdued. Simplistically, if the Fed wants to ease, it could just change its focus on inflation. Realistically, it is more complicated than that.
In economics, there is an indicator called misery index, which is arrived at by adding the unemployment rate to annual inflation. This is what is portrayed in Chart 4.
Rather revealingly, at least going back six decades, encompassing eight recessions, the Fed has never eased with the misery index as low as it currently is. As a matter of fact, when the Fed began hiking in December 2015, the index stood at 5.74, higher than the reading last month of 5.41. The closest it came was in May 1960 when the misery index was just under seven. This particular indicator argues for neutral to tighter policy, not looser.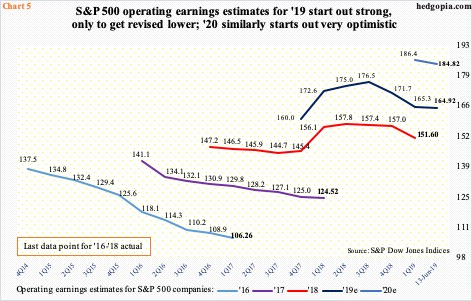
Hence growing odds that markets’ heightened expectations for rate cuts are on a collision course with the Fed. Curiously, expectations for a looser policy do not also jive with what they expect US companies to earn.
The sell-side is notorious for starting out optimistic and lower estimates as time passes. In Chart 5, which plots operating earnings estimates for S&P 500 companies, this was particularly true in 2016 and 2017. For 2019, these analysts expected as high as $177.13 last August, which has now been revised lower to $166. Next year, as things stand, they expect earnings to grow 12.1 percent, to $184.82. This follows growth of 8.8 percent this year and 21.7 percent in 2018. The economic cycle is long in the tooth.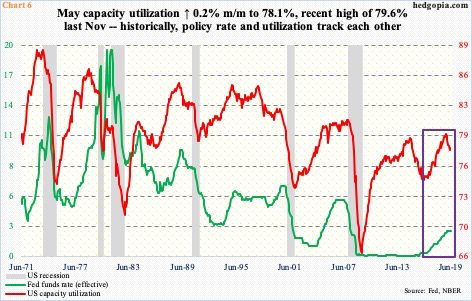
Markets are betting there was no way the Fed would allow the economy to contract. Hence aggressive expectations for easing. There are several data points that support this thesis. One is capacity utilization.
In the 12 months to May, utilization inched lower 0.01 percent to 78.1 percent. This was preceded by a 1.1-percent drop in April, which was the first decline since February 2017. Utilization has been under pressure since last November’s 79.6 percent. In the current cycle, which is a couple of weeks from completing a decade, utilization never crossed 80 percent (Chart 6). This is rare.
In the past, utilization and policy rates move in tandem. This time around, rates have gone sideways since last December, even as utilization headed lower. Markets are betting rates follow utilization lower.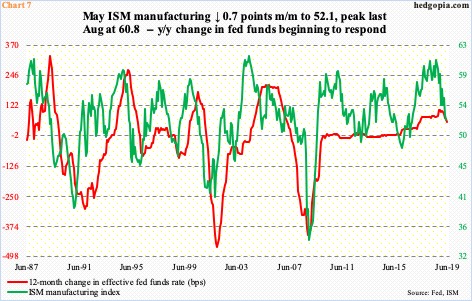
Similar dynamics are in play in manufacturing.
The ISM manufacturing index in May fell seven-tenths of a point m/m to 52.1 – a 31-month low. Last August, the index reached 60.8, which was the highest since May 2004. Historically, it is hard to sustain readings north of 60. If weakness persists, the red line in Chart 7, which shows the y/y change in the fed funds rate, follows. It is in decline since peaking last November.
Charts 6 and 7 are factors that FOMC doves can use to argue their case. At the same time, members are looking at a situation in which the unemployment rate is near a six-decade low and stocks are within striking distance of record highs – not quite a recipe for aggressive easing. Come Wednesday, they could very well throw a curve ball and refuse to buckle under what markets are demanding of them. Should it come to pass, this will be a new development under Mr. Powell. Under Janet Yellen and Ben Bernanke in particular, markets stared the Fed down more often than not. As it is, markets are not ready for a Fed willing to put its foot down.
Thanks for reading!
