
- Markit forecast of sub-200k private payroll growth this month a surprise
- U.S. unemployment claims, near historical lows, need catalyst to begin to move up
- Oil-heavy states are yet to see jobs impact of drop in crude, but only a matter of when, not if
The Markit flash U.S. services PMI for December raised a few eyebrows. U.S. service-sector output growth hit 10-month low. Even more worrisome, the rate of job creation eased to its weakest since April.
This from Markit:
“…The extent of the slowdown suggests that economic growth in the fourth quarter could come in below 2%…payroll numbers across [manufacturing and services] sectors showed the smallest rise for eight months. Another bumper month of non-farm payroll growth looks unlikely in December, with private sector payroll growth unlikely to breach the 200,000 mark.”
So what happened? Did someone suddenly turn off the switch or something? We just had a banner November. A total of 314,000 private-sector jobs were created last month (and 321k total non-farm).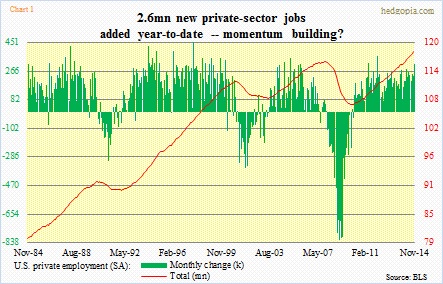
Now, there is no question that the recovery has been sub-par. Six years into it, we only have 1.7mn more non-farm jobs versus pre-Great Recession. Several employment-related metrics have fallen acutely short – from falling civilian labor force participation rate and employment to population ratio to a rising share of part-timers. But from the job creation point of view, 2014 has fared much better than the previous five years. In the first 11 months, 2.6mn private jobs have been added (2.7mn non-farm). Momentum seems to be on the right track (Chart 1).
So if Markit is right, a question arises: Is this a one-off or the beginning of a trend?
The November ISM surveys also showed that some deceleration on the jobs front could be at hand. Its non-manufacturing employment index dropped to 56.7 from 59.6, which was the highest since August 2005. On the manufacturing side, it dipped to 54.9 from a recent high of 58.2.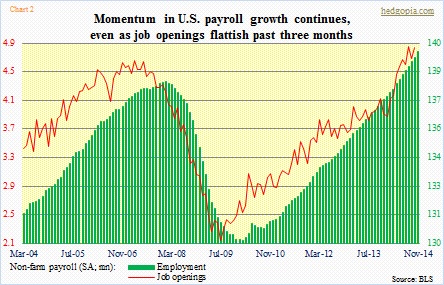
Job openings, derived from the Bureau of Statistics’ JOLTS survey, have gone flattish (4.85mn in August, 4.67mn in September, and 4.83mn in October). The series only goes back to 2004, so it has only seen one peak and valley each. On both occasions, job openings led non-farm employment by about six months. Should this correlation prevail, a flattish reading the past few months could mean softness in job creation in the early months of next year. But the series does not have enough data points to genuinely hang our hat on. It is possible the lead time is not six months, but shorter (Chart 2).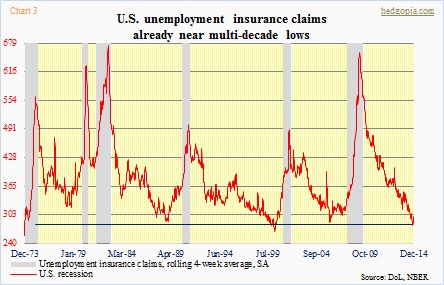
From a longer-term perspective, the real concern is not December. Far from it. It is 2015. Unemployment claims have fallen to levels that in the past have acted as a floor (Chart 3). For claims to begin to move up, there needs a catalyst. Until just a few months ago, one could think of none. Now, one sector has come into focus. Energy.
Enough has been written about the sharp drop in the price of oil the past six months. (Incidentally, Chart 4 also shows that the WTI has had a nice correlation with QE. Accordingly, the price peaked ahead of QE3-end. And also that it has diverged from stocks, with the latter having so far also diverged from QE3.)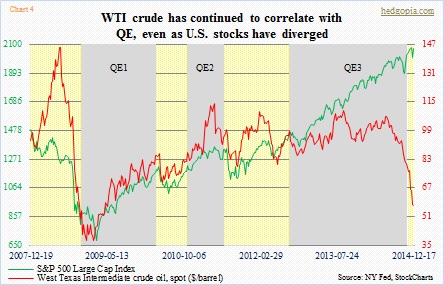
One of the main casualties of the collapse in oil price is destined to be capital expenditures. We will begin to hear from energy companies come January/February when they report 4Q earnings and provide 2015 capex plans. Besides shrinking cash flows, financing costs are now rising. As per Bank of America Merrill Lynch, the average borrowing cost for energy companies in the U.S. high-yield debt market has surged 80-percent-plus to 10.4 percent from an all-time low of 5.7 percent in June. And this market was responsible for fuelling the shale revolution. Between 2005 and 2014, the weight of U.S. energy companies in Barclays U.S. Corporate High Yield Bond Index rose from below five percent to over 15 percent. Total debt for listed U.S. E&P firms has nearly doubled since 2009 to $260bn (courtesy of Bloomberg).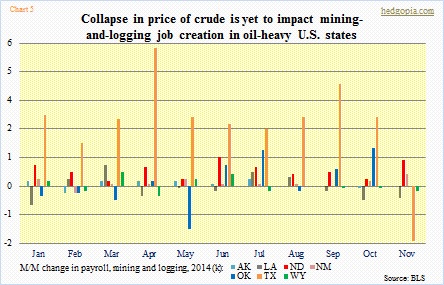
But here is the thing. Because operating costs are low due to sunk costs (there is wide variance, but I have seen some estimates that are in the $20s and $30s), these producers will probably continue to pump oil. Which also means massive layoffs may not result just yet. So it may take some time before that red line in Chart 3 begins to move.
And we see this in official data. Chart 5 shows month-over-month change this year in mining and logging jobs in seven states (AK, LA, ND, NM, OK, TX, and WY). Since June, which is when oil peaked, there has not been much slowdown in momentum. TX is losing some thrust, though. If that continues, that will begin to matter. In less than five years, the state’s share of U.S. oil production has risen from 25 percent to over 40 percent (courtesy of JP Morgan). Chart 6 is the same way. It shows the share of mining and logging in total private payroll in these states, and the industry has maintained its share, if not increased. Notice the rising trend in ND (red line).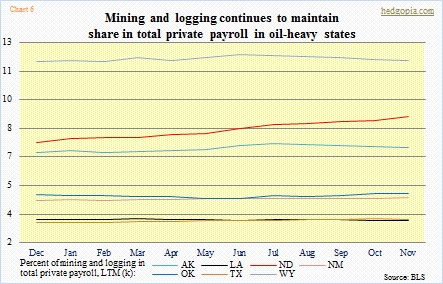
For now, things look normal. Beneath the surface of this tranquility, there is turbulence building. Plates are shifting. It is just a matter of time before that red line in Chart 3 begins to move – up. Before that happens, hiring should first grind to a halt. It is possible that is what the Markit survey is catching.
