
In the last few weeks, money has moved out of money-market funds which ballooned to just under $5 trillion, but not into stocks. Equity bulls are hoping the so-called cash-on-the-sidelines will find a home in stocks. The problem is, major equity indices have rallied in the 40 to 50 percent range in just the last two and a half months, with some technical deterioration in the S&P 500. Plus, the Fed’s balance sheet is no longer growing the way it was in March, April and May.
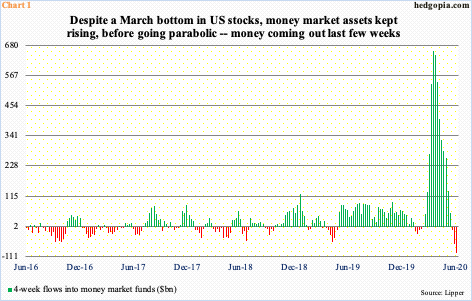
US money-market assets peaked just under $5 trillion four weeks ago. ICI data show that from record high $4.79 trillion as of the week to May 20th through last Wednesday, these funds dropped by $104.7 billion, to $4.68 trillion. This follows a parabolic increase particularly since February. In the week to February 19th, these funds held $3.63 trillion. This was when major US equity indices peaked. By March 25th, they stood at $4.22 trillion. On the 23rd that month, equities bottomed, but money-market assets kept growing. The massive rally that followed was unable to lure in these funds.
Chart 1 uses Lipper data to plot four-week flows into money-market funds. As of last Wednesday, they amounted to outflows of $97.1 billion. In the week to April 1st, inflows were $659.5 billion. Clearly, there is a lot of cash parked in these funds. Equity bulls consider this so-called cash-on-the-sidelines as a reason to be bullish about, with the hope that money coming out of these funds will find a home in stocks.
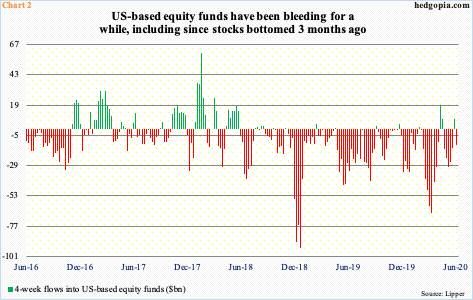
Here is the thing. This did not happen in the last four weeks, during which a combined $12.6 billion came out of US-based equity funds (Chart 2). This is lower than the four-week outflows of $66.4 billion in the week to March 25th, but the fact remains that funds leaving money-market assets are yet to meaningfully move into stocks. In the last four weeks, bonds were the largest recipients, with taxable bonds gaining $41.5 billion, investment-grade corporate $31.2 billion and high-yield $18.4 billion.
And then this. Money-market funds and equity funds are not very strongly inversely related. At least going back to September 2015, the correlation coefficient (r) between Charts 1 and 2 are minus 0.297. There is an inverse relationship alright but it is not very strong.
As far as stocks are concerned, there is one more potential headwind circling overhead.
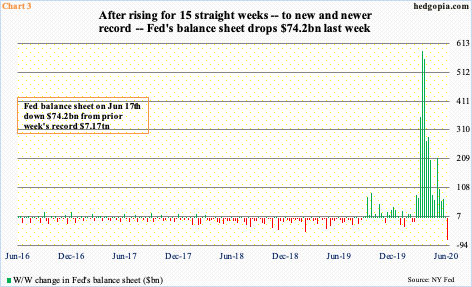
When stocks bottomed in March, the Fed played a major role. In fact, it was the catalyst. On March 23rd, the very day stocks bottomed, it announced an open quantitative easing (QE) as well as established the Secondary Market Corporate Credit Facility, under which it would buy corporate bonds issued by US companies that were investment grade as of March 22nd. This was later expanded to include junk bonds.
By then, its balance sheet had already been growing. It had $3.76 trillion in assets late August last year. By early March this year, this grew to $4.24 trillion, before going parabolic, reaching $7.17 trillion in the week to June 10th. In the week to March 25th, the balance sheet expanded by as much as $586.1 billion, before the growth rate decelerated. In fact, last week, it contracted by $74.2 billion – the first negative week in 16 (Chart 3).
From investor sentiment’s perspective, this could prove to be important – potentially.
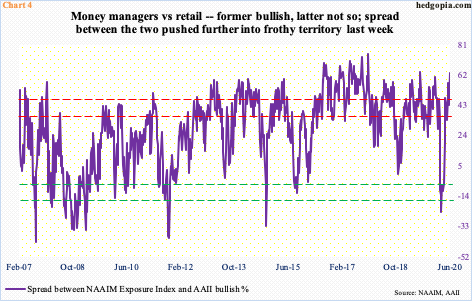
Several sentiment metrics are already extended. Investors Intelligence bulls last week fell two percentage points from prior week’s 56.9 percent, which was a 20-week high; bears, too, fell two percentage points to 18.6 percent. The NAAIM Exposure Index, which represents National Association of Active Investment Managers members’ average exposure to US equity markets, rose 10.8 points week-over-week to 88.3; the 91.6 reading three weeks ago was a 19-week high. AAII bulls, however, are suppressed, down 9.9 percentage points w/w to 24.4 percent last week – a five-week low.
It turns out there is an interesting relationship between money managers and retail investors. The big fish versus the small fry. At its extreme, a spread between the two can be taken as a contrarian signal. Currently, last week’s 63.9 pushed the spread further into frothy territory (Chart 4).
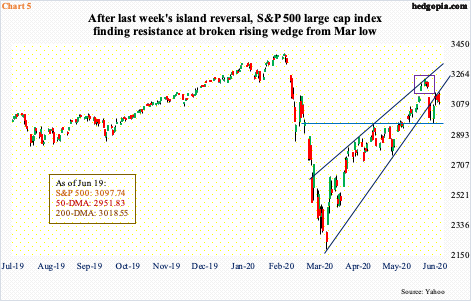
This is taking place even as the S&P 500 large cap index (3097.74) finds itself at an interesting juncture.
Between the March 23rd low and the June 8th high, the index rallied 47.5 percent. That is a lot of paper profit for two and a half months’ work. Several sessions ago, an island reversal formed on the index (violet box in Chart 5). Concurrently, it fell out of a rising wedge from the March lows.
Before all this could morph into serious weakness, bulls last Monday defended 2950s-60s breakout from late May. In the subsequent sessions, though, the broken wedge was back-tested several times – all unsuccessfully. In the right circumstances for bears, a potentially bearish cross-down between the 10- and 20-day could be in the process of completing. Should that happen, it is only a matter of time before 2950s-60s gets tested again, with the 50-day at 2951.83.
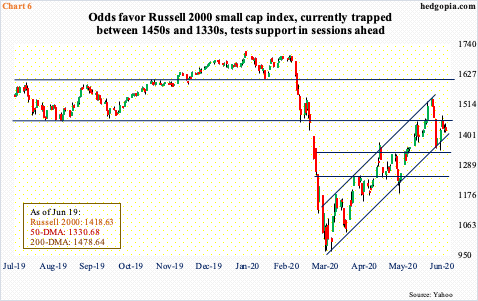
Small-caps are at a similar interesting juncture.
From its March 18th intraday low through the June 8th high, the Russell 2000 small cap index shot up just north of 59 percent. Once again, this was all in two and a half months! After a move like this, digestion only makes sense, and we could be witnessing one.
The June 8th high of 1537.62 kissed the upper bound of a three-month ascending channel (Chart 6). The selloff that followed stopped last Monday at horizontal support at 1330s, which approximated the lower bound of the channel. After that, bulls once again charged toward 1450s and were denied. Odds favor the Russell 2000 (1418.63) tests 1330s again before bulls manage a 1450s breakout, if at all.
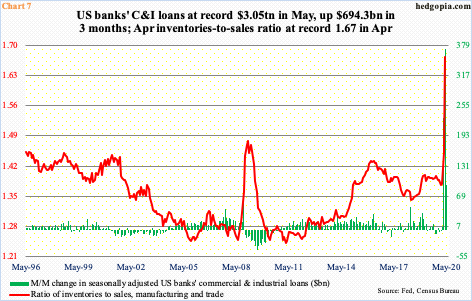
All this is transpiring even as the macroeconomy continues to come under stress. The inventories-to-sales ratio in manufacturing and trade went from 1.39 in January to 1.67 in April – a record (Chart 7). The problem is not so much with inventory build but sales slump. During the period, inventories went from $2.02 trillion to $1.98 trillion, and sales from $1.47 trillion to $1.18 trillion. The former was at a 17-month low, while the latter was the lowest since February 2011.
In the past, an increase in the ratio was accompanied by an increase in banks’ commercial & industrial loans as corporations accumulated inventories. This time too, C&I loans has spiked but not for quite the same reason.
Between February and May, these loans surged $694.3 billion to $3.05 trillion – a new record. Much of this is due to the government’s paycheck protection program (PPP). Under the first phase, which lasted from April 3rd to 16th, $349 billion was quickly exhausted. The second round was rolled out on April 27th, with Congress providing an additional $310 billion. Combined, as of the 12th this month, the Small Business Administration disbursed $512 billion. The growth in C&I loans, however, exceeds this by a wide margin. As the Covid-19 began disrupting the economy, corporations began to tap credit lines, raising cash. Times are uncertain, and it does not hurt sitting on cash. That is the mentality right now.
The Fed, on its part, has tried to reduce uncertainty by aggressively expanding its balance sheet by massively broadening its horizon. We can argue if this was the right policy prescription or has nothing but encouraged moral hazard. The truth of the matter is that markets loved the balance sheet expansion. This would then follow that they should dislike the deceleration, which last week in fact evolved into reduction. The slight technical deterioration of late in the S&P 500 could be because of this.
Thanks for reading!
