
Wednesday, the Fed hiked by 25 basis points and the FOMC dot plot continued to forecast another hike this year and three more next. The 10-year T-rate lost four basis points in that session. It increasingly looks like $116 on TLT is safe for now.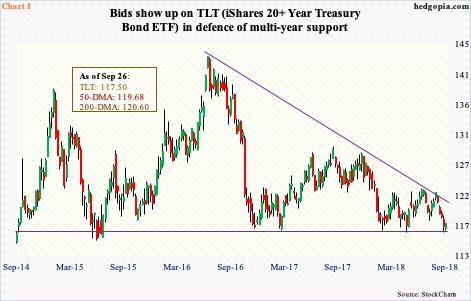
Following up on Monday’s post (more here), TLT (iShares 20+ year Treasury bond ETF) gave out more signs Wednesday that bond bulls were not ready to let go of crucial support at $116-plus. The ETF rallied 0.7 percent in the session to $117.50.
After dropping to $116.19 Wednesday last week, TLT has essentially gone sideways, which is healthy because (1) this is occurring right on or above seven-year horizontal support, and (2) this action preceded sustained drop in the ETF. As far back as July 2016, TLT peaked at $143.62. Most recently, it traded at $122.23 on August 24.
Consequently, the ETF finds itself within a descending triangle. A trend line drawn from that July 2016 high extends to $121, give and take (Chart 1). Bulls have a shot at this. Before this, $118 is where bulls and bears likely will lock horns.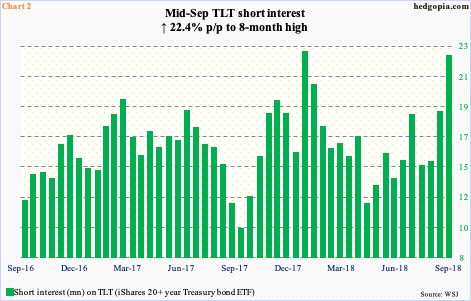
In the right circumstances for bulls, TLT short interest can come in handy.
Mid-September, short interest jumped 22.4 percent period-over-period to 22.7 million – an eight-month high (Chart 2). Mid-January, it peaked at 22.9 million. Back then, shorts got it right. By February 21, the ETF was down to $116.51. Shorts obviously expected this support to hold as they were taking advantage of the drop by covering. This time around, they have been adding as TLT approaches $116. It is possible they could be setting themselves up for a squeeze should bulls put their foot down. Thus far, that is what has happened.
TLT’s shorter-term averages are still dropping, so back-and-forth action makes sense here. As long as $116 holds, bulls deserve the benefit of the doubt.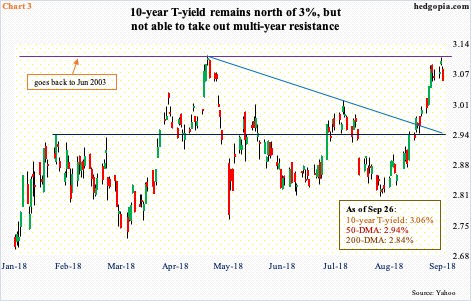
Concurrently, the 10-year Treasury yield (3.06 percent) is giving out signs of fatigue. Tuesday, it rose to an intraday high of 3.11 percent, nearly matching the high of 3.115 percent on May 17, before retreating (Chart 3). Wednesday – an FOMC decision day – it fell four basis points.
The fed funds rate went up 25 basis points to a range of 200 to 225 basis points. This was expected. The FOMC dot plot continues to expect one more hike this year and three in 2019. There are two meetings left this year – November (7-8) and December (18-19). A December hike is beginning to look like a lock, with the futures market increasingly leaning that way. Post-FOMC decision yesterday, December odds stood at 86 percent. Next year, however, is another story. Markets only expect one 25-basis-point hike.
The 10-year rate either agrees with the consensus or is beginning to price in a slowdown in the economy. Resistance at north of three percent goes back 15 years. The past five in particular, this has acted as a rock-solid ceiling. Bond bears spent a lot of energy in pushing the 10-year yield to this resistance. These notes were yielding 2.03 percent a year ago. Inability to continue to push higher at a time when the economy is as strong as it is can be taken as a tell – at least near term. The daily chart is itching to go lower. There is support at three percent, or 2.94 percent just below that. Should things evolve this way, TLT does not risk a violation of $116 – at least not now.
Thanks for reading!
