
In the midst of a flattening yield curve, the 10-year T-yield is once again hammering on resistance at just north of three percent. Just a month ago, these notes yielded 2.81 percent. At least a pause is due, raising the odds that TLT does not breach crucial support at $116-plus.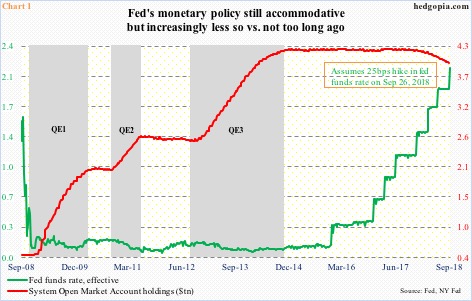
Tuesday, a two-day FOMC meeting begins. This will be the sixth meeting this year. They raised in March and June. Another 25-basis-point hike this week is priced in, bringing the fed funds rate to a range of 200 to 225 basis points. After this, two more meetings are scheduled this year – November (7-8) and December (18-19). Another 25-basis-point raise in the December meeting is looking like a foregone conclusion, with 86-percent odds in the futures market.
This is occurring even as the Fed is reducing its balance sheet. System Open Market Account holdings last week were $3.99 trillion, down from a peak of $4.24 trillion in April 2017.
Viewed historically, rates are still very low. They were a lot lower, having stayed between zero and 25 basis points for seven years, before the fed funds rate went up 25 basis points in December 2015. Since then, there have been six more hikes (Chart 1). The FOMC dot plot expects three more next year. Markets are not on board with this scenario. They expect one. If the latter is right, then by then the fed funds rate will be between 250 and 275 basis points – hardly restrictive in an economy with a sub-four unemployment rate and capacity utilization at just north of 78 percent.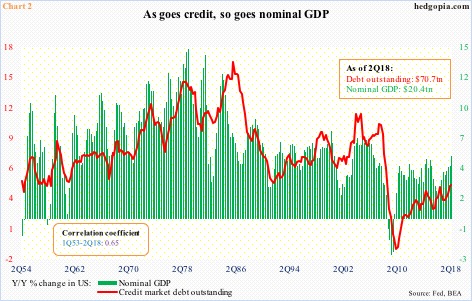
The Fed is between a rock and a hard place. Rates have risen, but they are hardly prohibitive. The longer monetary policy remains accommodative, the higher the probability of continued buildup in leverage.
Since Great Recession ended in 2Q09, US household debt (home mortgage plus consumer credit) rose from $13.2 trillion to $14.1 trillion, with home mortgage going from $10.6 trillion to $10.2 trillion and consumer credit from $2.6 trillion to $3.9 trillion. During the period, non-financial corporate debt rose from $6.5 trillion to $9.4 trillion, and federal debt from $11.5 trillion to $21.2 trillion. The economic recovery/expansion has seen no letup in debt buildup. In fact, this is what fuels growth – has been that way for decades.
Chart 2 uses year-over-year growth in credit market debt outstanding and nominal GDP. Correlation between the two is tight. The US economy is increasingly reliant on debt.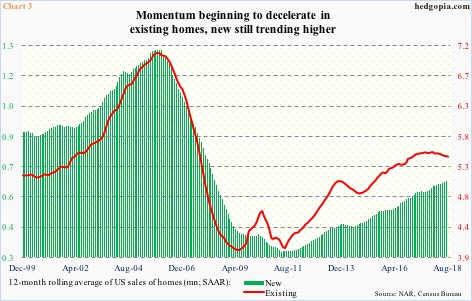
Hence the Fed’s dilemma whether or not to continue to remain accommodative and let leverage and asset inflation continue to build up or surprise the markets and continue to tighten until the economy is brought to its knees. Certain sectors of the economy are already not faring well, housing being one.
Sales of both new and existing homes reached cycle highs last November – respectively at a seasonally adjusted annual rate of 712,000 units and 5.72 million units. In August, sales of existing homes were flat month-over-month at 5.34 million, while sales of new homes in July dropped 1.7 percent m/m to 627,000. (August’s new home sales are due out Wednesday.)
As Chart 3 shows, using a 12-month rolling average, sales of existing homes in particular have decidedly turned lower, while new home sales are hanging in there.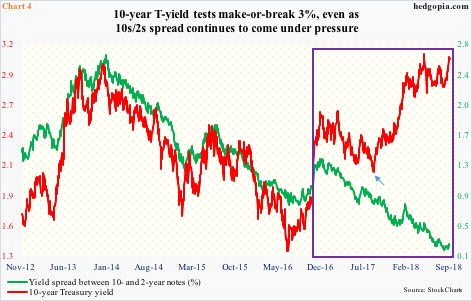
Housing is weak, but several other sectors of the economy are humming along. Real GDP expanded 4.2 percent in 2Q18 (the third estimate will be out Thursday). As of last Wednesday, the Atlanta Fed’s GDPNow model forecasts another 4.4-percent growth in the current quarter. Last December’s tax cuts and subsequent increase in fiscal spending have given a boost to the economy. The yield curve is pretty much saying this is not going to last. Once the effect of this stimulus begins to wear off, activity likely cools down.
The spread between two- and 10-year Treasury yields on August 27 fell to a mere 18 basis points, matching the low of 11 years ago. The green line in Chart 4 has been caught in a downtrend since early 2017. In contrast, the 10-year rate (3.07 percent) bottomed a year ago at 2.03 percent (arrow in Chart 4). Last Thursday, it rose to 3.1 percent. Two-year yields rose from 1.27 percent to 2.81 percent during the period.
Here is the thing.
Two-year yields tend to be sensitive to Fed policy. If the dot plot is right about the Fed’s tightening path for next year, these yields are headed higher. The 10-year does not necessarily have to move in tandem. As a matter of fact, it currently sits at a crucial technical juncture.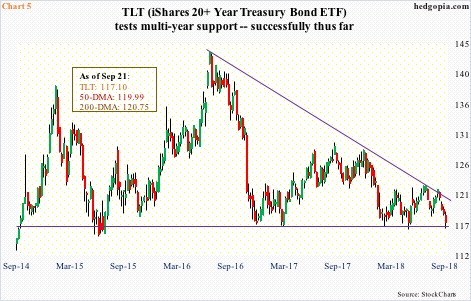
The last time the 10-year yielded just north of three percent before coming under sustained pressure was December 2013, when it retreated after hitting 3.04 percent. By July 2016, it fell to an all-time low 1.34 percent. This April, the 10-year yield broke out of a three-decade descending channel. Although building on it has proven difficult, as resistance at just north of three percent consistently repelled rally attempts.
The 10-year has rallied in the past month having bottomed at 2.81 percent on August 22. Accordingly, daily conditions are extremely overbought, with last Thursday producing a hanging man and Friday a long-legged doji. At least a pause is due. There is support at 2.94 percent, and 2.62 percent after that. The latter is significant.
Concurrently, TLT (iShares 20+ year Treasury bond ETF) is at a crucial level. Support at $116-plus goes back seven years. In fact, the ETF has traded within a descending triangle for two-plus years now (Chart 5). More often than not, this tends to be a continuation pattern, meaning a breakdown can occur eventually. If that does not happen right away, it can rally to test trend-line resistance, which in this case lies around just under $121. Well before TLT ($117.10) can get there, there is resistance at $118.
After dropping intraday to $116.19 last Wednesday, bids showed up in the next two sessions. Odds favor TLT stabilizes here for at least a relief rally. In this scenario, hypothetically, an October 5 117 short put brings in $0.88. It is naked, so if put, it is a long at $116.12.
Thanks for reading!
