
The top five in the Nasdaq 100 are done reporting 2Q. They have had their post-earnings reaction – mostly positive. This is occurring even as the index just got repelled at six-month channel resistance. If bulls do not put their foot down soon, there is a lot to go on the downside on the weekly chart.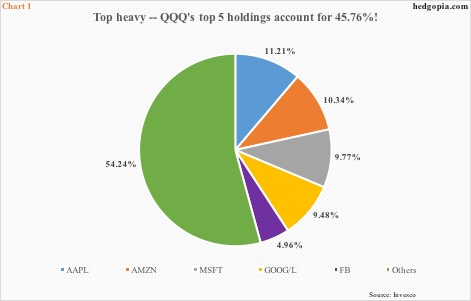
In the Nasdaq 100 index/QQQ (Invesco QQQ Trust), the top five weights – Apple (AAPL) 11.2 percent, Amazon (AMZN) 10.3 percent, Microsoft (MSFT) 9.8 percent, Alphabet (GOOG/L) 9.5 percent (both A and C class) and Facebook (FB) five percent (Chart 1) – have reported their 2Q18. Post-earnings reaction was positive for the first four, even as FB (171.65) was treated with a 19-percent drubbing last Thursday, with an all-time high of 218.62 reached the day before. It also lost both 50- and 200-day moving averages.
AAPL (201.50) reported this Tuesday, notching a fresh high of 201.76 Wednesday and closing the session near the high. Bulls would like that. That said, the 5.9-percent post-earnings rally also puts it right at the upper bound of a two-plus-year rising channel. AMZN (1,797.17) reported last Thursday; Friday, it rose to a new intraday high of 1,880.05, before reversing lower. It is showing signs of fatigue. Week-to-date, a hanging man has formed on AMZN’s weekly chart, with a weekly long-legged doji and a doji before that. MSFT (106.28) last week reached an all-time high of 111.15 but also produced a shooting star. This was preceded by a spinning top the week before. GOOGL (1,232.99) rose to a new intraday high of 1,291.44 last week, but the weekly candle came with a long wick.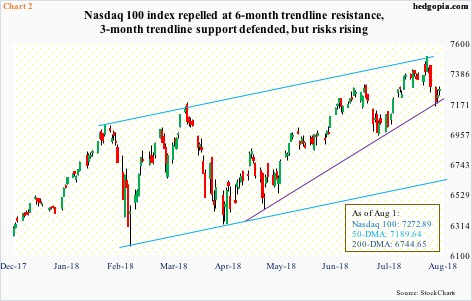
On AMZN, MSFT and GOOGL, bulls and bears are fighting a tug of war around shorter-term averages. So back-and-forth action is normal, until they are either lost or recaptured. Medium term, odds heavily favor the bears. Near term, it is a coin toss, although momentum is beginning to shift against the bulls.
The Nasdaq 100 Wednesday last week rallied to a new high of 7511.39, but only to come under pressure since. The index was repelled right at the upper bound of a six-month rising channel (Chart 2). The 50-day was tested Monday and then again on Tuesday, and has held thus far, but not very convincingly. Both those sessions produced spinning top candles. The average also approximates trend-line support from April. The daily chart is beginning to get oversold, but if the index is not able to rally soon, odds grow this support gives away.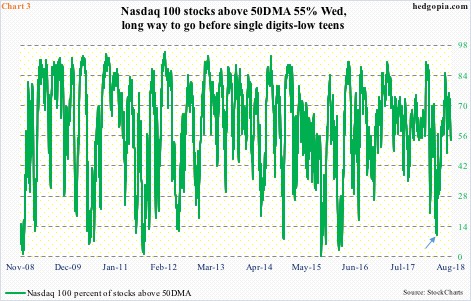
In this scenario, the weekly chart can take over, which is grossly overbought. In fact, several momentum indicators have turned lower, and have a long way to go before they get oversold. This is also true with the percent of Nasdaq 100 stocks above the 50-day. As is the case with the Nasdaq 100 itself, this metric is getting oversold on a daily basis. Once again, this is an opportunity for the bulls to put their foot down. Else, Chart 3 has a lot to go on the downside before a sustainable bottom is formed. Wednesday, 55 percent were above their 50-day. As early as early April, the green line dropped to 10 percent (arrow).
Thanks for reading!
