
The S&P 500 is itching to make a new high. The Nasdaq 100 achieved that feat last Friday. Lowered earnings estimates for the third quarter went a long way, among others. Bulls have momentum right now. Medium- to long-term, massive buildup in VIX shorts in the futures market is beginning to raise the red flag.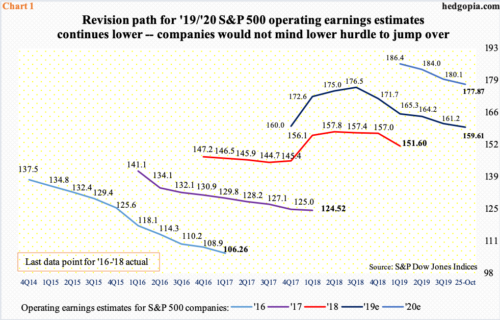
With 47 percent of S&P 500 companies reporting, 3Q19 blended estimates were $40.02 as of last Friday. When the quarter ended, these companies were expected to ring up $40.81. A lower bar has helped. To date, 77.2 percent have beat, which is high historically.
The downward revision trend into earnings is not a new phenomenon. In fact, when 3Q began, the sell-side had penciled in $42.47 for the quarter; going back further, estimates were $45.11 last November. These analysts have also been lowering the bar for 4Q and next year.
As things stand, $159.61 is expected this year, down from $177.13 in August last year. Next year is at $177.87, versus a high of $186.36 in March this year (Chart 1). Considering these numbers reflect a 11.4-percent growth next year, the path of least resistance is probably lower, particularly for next year.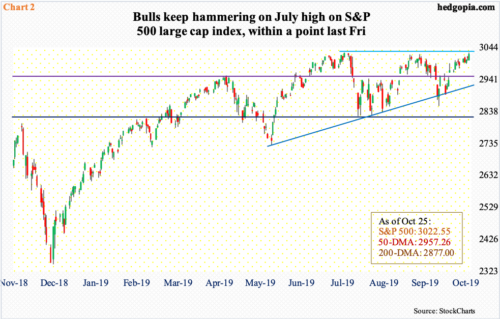
For the most part, during earnings season traders live and die by whether or not companies beat consensus estimates. Last Friday, Amazon (AMZN) was punished for a 1.1-percent drop, although at one point in time it was down as much as 4.8 percent. Intel (INTC), on the other hand, jumped 8.1 percent.
In tech, two prominent names report their September quarter this week – Alphabet (GOOG) later today and Apple (AAPL) on Wednesday. In the last 90 days, AAPL’s has gone up from $2.67 to $2.84, while GOOG’s has slightly gone down from $12.47 to $12.42. Based on if they deliver – or if they are perceived to have delivered – their results will reverberate through major indices such as the S&P 500 large cap index. AAPL makes up 4.1 percent of the index and GOOG three percent. AAPL is at a new high, and GOOG is itching to break out.
Concurrently, the S&P 500 in the right circumstances has room to break out to a new high. Intraday Friday, the index (3022.55) was less than a point from posting a new high (Chart 2). Its all-time high was set on July 26 at 3027.98.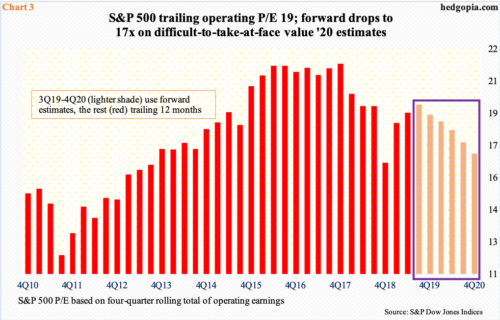
The S&P 500 has rallied nicely since bottoming intraday at 2855.94 on the 3rd this month. Once again, the lowered earnings bar probably played a role here. As a result, the daily is way extended, with the weekly beginning to get overbought as well. Even if the index rallies to a new high, staying there can become difficult. Not when lowered earnings estimates in combination with rising stocks has pushed up multiples. Value investors are finding fewer opportunities.
The S&P 500 currently trades at a trailing P/E of 19 (Chart 3). Using the blended estimates of 3Q, it rises to 19.4. But using 2020 estimates, the multiple drops to 17, which is not cheap by any stretch of the imagination. Besides, next year’s estimates likely get revised downward as the time passes. Cynically, this makes companies’ job of ‘beat and/or raise’ easier.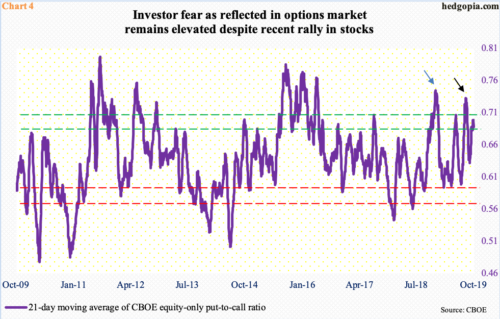
If earnings continue to cooperate and major indices post new highs, a scenario can be thought of in which the options market can further help the bulls – at least near term.
Stocks are rallying, but at the same time protection is being sought. Last Friday, the CBOE equity-only put-to-call ratio printed 0.56. In the prior nine sessions, readings were in the 0.60s, one of them 0.99. This was a time when the S&P 500 had already recaptured its 50-day moving average and was trudging higher. It has now had three positive weeks.
Consequently, the 21-day moving average of the ratio ended last week at 0.688, down from 0.699 on the 18th. Historically, the ratio tends to unwind from high 0.60s to low 0.70s. It is possible stocks come under pressure near term, and the ratio continues higher. On August 23, it rose to 0.733 (black arrow in Chart 4) and to 0.744 on December 24 (blue arrow), before unwinding, which laid the foundation for the rallies that followed. It is equally possible it continues to unwind.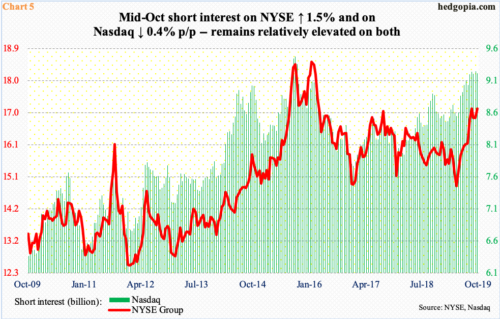
If this is how things evolve, bulls would love to get a taste of short squeeze. Shorts continue to get aggressive, and the last time they were rewarded meaningfully was during the October-December decline in stocks last year (Chart 2). Other than that, they have either gotten squeezed or were forced to cover at/near support.
By the middle of October, NYSE and Nasdaq short interest stood at 17.1 billion and 9.2 billion shares, up 1.5 percent and down 0.4 percent period-over-period, in that order. Since bottoming at the end of April, they have respectively risen 15.2 percent and 7.8 percent. Short interest remains elevated.
It is possible shorts are waiting to see if indices manage to rally to new highs. In fact, the Nasdaq 100 did rally to a new high last Friday, albeit not by much. Next week’s trading, from this perspective, will be watched closely.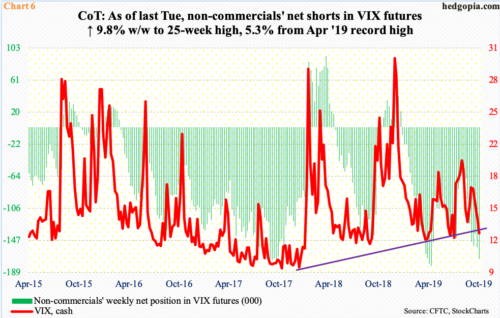
This is near term. Medium- to long-term, risks are building.
Last Friday, VIX (12.65) lost short-term support at 13.50s. On an intraday basis, a rising trend line from April this year extends to 12, which, if tested, will have tested July lows as well as the daily lower Bollinger band. As recently as October 2, VIX tagged 21.46 intraday.
In the futures market, non-commercials accordingly have fared well. As of last Tuesday, they held 171,236 net shorts in VIX futures, up from 57,153 contracts two months ago. At the end of April, net shorts reached 180,359 – a record (Chart 6).
These massive holdings will get unwound eventually. In the past, the cash has tended to peak once these traders either get net long or have substantially cut back their net shorts. Once this process begins, equity bulls will be pulling in their horns.
Thanks for reading!
