In the latest period, Nasdaq/QQQ shorts went on an offensive. The index/ETF rallied to a fresh high last Friday. Longs are salivating over the jump in short interest as yet another squeeze opportunity. In the past, zealous bears have repeatedly been forced to cover helping the bulls, but this does not necessarily have to always end in a similar fashion.
It is easy not to like the present fundamental story. The US economy has been ravaged by the Covid-19 pandemic. Most macro data for February, March and April were abysmal, with some improvement in May. June numbers for several metrics will be out this week, including retail sales, which will be out Thursday.
Retail sales peaked in January at a seasonally adjusted annual rate of $529.6 billion. Then the virus hit, and the bottom fell out. By April, sales were down to $412.6 billion. May snapped back with a month-over-month growth of 17.7 percent but remains 9.1 percent from the record high.
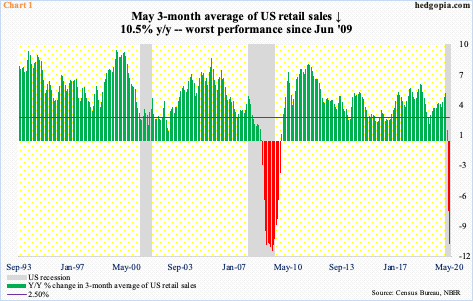
Numbers have been volatile the last several months. A three-month average helps smooth this out. On that basis, sales were down 10.5 percent year-over-year in May, which was the worst performance since June 2009 (Chart 1). In the last recession, this metric got stuck in the negative territory for 14 straight months.
Data like this fan negative sentiment. April’s retail sales were at a seven-year low. In that same month, the University of Michigan’s consumer sentiment index hit 71.8 – the lowest since December 2011 (not shown here).
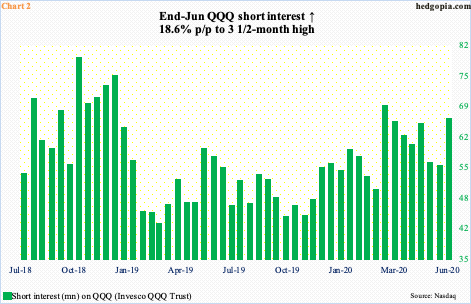
Leading up to this, as stocks collapsed in February and March, shorts were getting aggressive. Mid-March, short interest on QQQ (Invesco QQQ Trust) jumped to 68.5 million shares – a 15-month high. Major US equity indices, including the Nasdaq 100, bottomed on March 23rd. Soon, shorts turned tail, cutting QQQ short interest to 55.3 million by mid-June, providing a big tailwind for QQQ/Nasdaq 100.
This phenomenon has been going on for a while. Zealous bears seize on lousy fundamental data, aggressively build short position, bulls stay put, and a squeeze follows. Shorts are at it again.
At the end of June, QQQ short interest jumped 18.6 percent period-over-period to 65.6 million, which is a three-and-a-half-month high (Chart 2). Yet again, bulls are staring at a squeeze opportunity.
This is taking place at a time when there is an implied backstop from the Fed that anytime equities come under decent pressure, they will step in.
On March 23rd, the same day US stocks in general put in a low, the Fed announced an unlimited QE (quantitative easing) as well as said it would begin buying investment-grade corporate bonds, which on April 9th was expanded to include junk bonds.
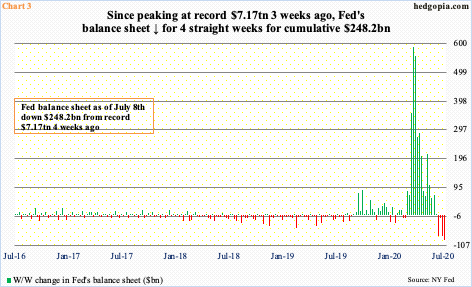
Consequently, the Fed’s balance sheet, which had already been growing since last September, surged from $4.24 trillion early March to $7.17 trillion in the week to June 10th. Since that peak, it has gone down for four straight weeks, to $6.92 trillion last week (Chart 3).
Incidentally, the S&P 500, too, peaked on June 8th. But not the Nasdaq 100, which keeps making new highs. Shorts in all probability are contributing to this.
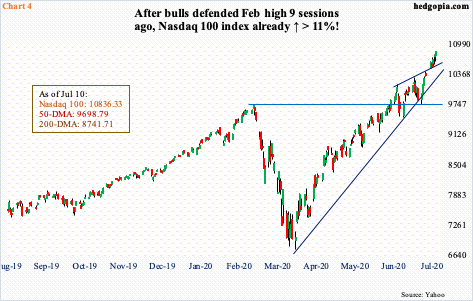
Along with the Nasdaq composite, the Nasdaq 100 is the only major US equity index to have surpassed the February high, which took place five weeks ago. There was a successful retest of that breakout nine sessions ago. Since then, the index (10836.33) has gone parabolic, rallying north of 11 percent in nine sessions (Chart 4)!
Subtle signs of distribution are there, with last Tuesday forming a shooting star and Thursday a hanging man. But momentum is intact. The 10-day does not get tested until 10397.42. Last week’s candle was a green marubozu.
Bulls obviously would like this momentum going, particularly considering that the 2Q20 reporting season begins in earnest this week. Financials will get the ball rolling, of course, with JP Morgan (JPM), Wells Fargo (WFC) and Citigroup (C) reporting Tuesday, and Bank of America (BAC) and Morgan Stanley (MS) Thursday. Tech is a little later. Of the big five, Microsoft (MSFT) reports on the 22nd, Amazon (AMZN) on the 23rd, Facebook (FB) on the 29th and Apple (AAPL) and Alphabet (GOOG) on the 30th.
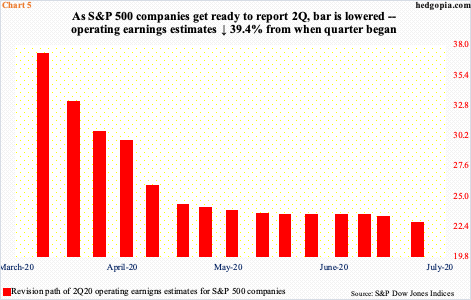
As these companies are getting ready to report, the bar customarily is low. Versus 90 days ago when it was expected to earn $6.12, AMZN is now expected to bring in $1.34. On AAPL, this is $2.01, versus $2.15 90 days ago, on MSFT $1.38 versus $1.40, on FB $1.37 versus $1.68 and GOOG $8.23 versus $11. The point is, the sell-side has given them a lower hurdle to jump over.
In fact, this is true for the entire S&P 500 companies. From the end of March, which is when 2Q began, 2Q estimates went from $36.94 to $22.37 (Chart 5). Last year, these companies earned $40.14.
Companies could surprise on the upside. Given the massive rally into earnings, it could very well be a ‘sell the news’ phenomenon. It is equally possible the momentum continues, and shorts end up getting squeezed. On the Nasdaq, end-June short interest rose to the highest since mid-September 2008 (chart here).
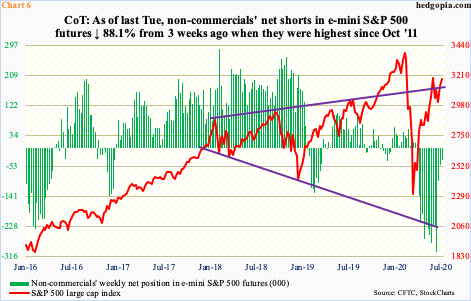
Speaking of short squeeze, what just transpired in e-mini S&P 500 futures could serve as an example. As recently as the week to June 16th, non-commercials had accumulated 303,305 net shorts – the highest since October 2011. It seemed they were onto something. The S&P 500 had just formed an island reversal as well as lost a rising wedge from March. But before this could morph into serious selling, bulls defended the 50- and 200-day moving averages as well as horizontal support at 2950s-60s. Non-commercials decided to cut back and cut back they did. As of last Tuesday, they were only net short 36,174 contracts (Chart 6). Last week, the S&P 500 (3185.04) rallied 1.8 percent, and four percent before that.
Equity bulls’ hope is that the rather elevated Nasdaq/QQQ short interest ends up similarly, but it may not. There are just too many variables that could potentially impact how they trade in the weeks/months ahead. Elevated short interest does not have to always result in a squeeze. As mentioned earlier, Nasdaq short interest is the highest since mid-September 2008. Back then, shorts made a killing, as the index collapsed from 2367.52 in August that year to 1265.52 in March 2009.

As things stand, tech is massively leading, but this risk-on behavior is not evident in other metrics. Small-caps continue to lag their large-cap peers. Even within large-caps, the big five dominate. More importantly, gold, which traditionally is considered risk-off, is rallying along with stocks.
On March 16th, the metal (1,801.90/ounce) bottomed at $1,450.90. Stocks in general bottomed a week later. Then, they rallied together. Gold bugs progressively took care of one after another roadblock – $1,560s, $1,700 and most recently $1,750s, not to mention the 50- and 200-day. The latest breakout took place three weeks ago.
In the last four months, the yellow metal has come a long way. The daily remains extended. In the event of a pullback, $1,750s retest is key. A bigger tell would be if gold bugs are unable to save $1,700. In this scenario, squeeze odds of Nasdaq shorts grow.
Thanks for reading!

