
Last week, Fed officials threw cold water on incipient taper talk, making it clear they would continue to purchase treasury securities. This followed a backup this month in rates in the long end of the treasury yield curve, with the 10-year crossing one percent. In a highly leveraged economy, higher rates can bite sooner than many think possible. The Fed will do all it can to make that from happening.
Last week, several Fed officials, including Chair Jerome Powell and Vice Chair Richard Clarida, sought to nip budding tapering talk in the bud; the 10-year treasury yield, up eight basis points at Monday’s high, ended the week down a basis point to 1.11 percent.
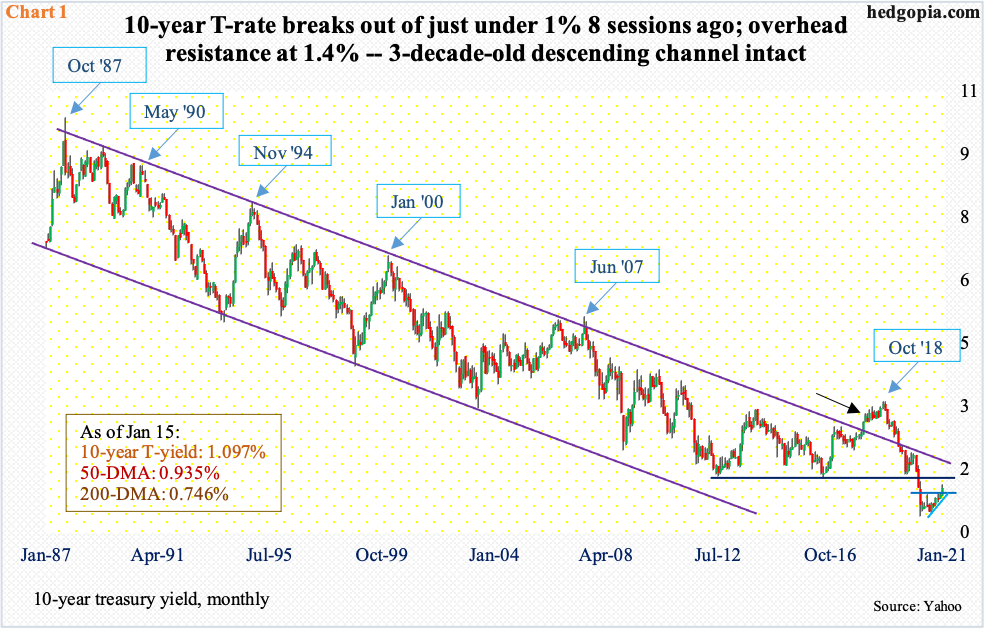
Fed officials were reacting to a mini selloff in bonds in the prior week. On January 6, the 10-year jumped 9 basis points to reclaim one percent – up 19 basis points for the week. Rates had not taken the one handle since last March.
Technically, this can prove to be an important breakout. Several times between June and December last year, the 10-year retreated from just under one percent. Concurrently, for the past five months in particular, a pattern of higher lows had been in place.
Longer term, rates remain within a three-decade-old descending channel. There was a breakout in 2018, but that proved false (black arrow in Chart 1). There is major resistance just under 1.4 percent, which also corresponds to the upper trend line of the channel. In the right circumstances, bond bears (on price) have a shot at this. Although after Fed officials intervened, last week’s candle left behind a long upper shadow on the weekly.
Behind the latest breakout in the 10-year yield was rerating by bond vigilantes of inflation/growth expectations in the wake of Georgia Senate runoff elections on January 5. Democrats won both seats, taking their tally to 50, with an ensured tie-breaking vote from Vice President-elect Kamala Harris. Democrats already control the House and will the White House at noon tomorrow.
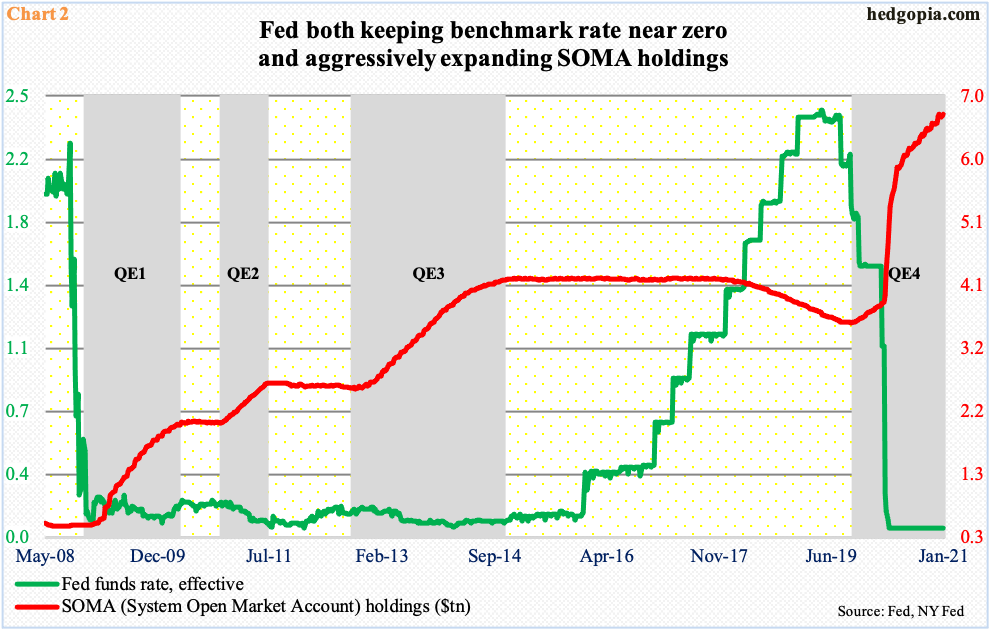
The recapturing of one percent caused a small subset of markets to speculate that it would not be long before the Fed, too, took note of changing market sentiment and stopped purchasing these securities. Speaking to the press at the end of the December 15-16 FOMC meeting, Powell said the central bank would buy $120 billion/month in mortgage-backed securities and treasury notes and bonds. If the pace is sustained for the next six months, by July it would hold $6.9 trillion in these securities.
The Fed funds rate is already near zero. SOMA (System Open Market Account) holdings have gone vertical from $3.9 trillion last March to $6.7 trillion (Chart 2). On the 23rd that month, the Fed announced unlimited quantitative easing; in that very session, after an ugly February and March, US stocks bottomed.
Back then, the Fed apparently was responding to Covid-19 and the disruption it caused in the economy. Now that the vaccine is here and the collective wisdom of markets expects things to get better in the months and quarters to come, it is befuddling to see Fed officials react the way they did last week, as they made it clear they would continue to purchase these securities. The 10-year is hardly past one percent. As recently as August 2019, these notes yielded north of two percent.
So, why panic? The answer lies in the word leverage, which remains elevated on all levels – be it federal, corporate or household.
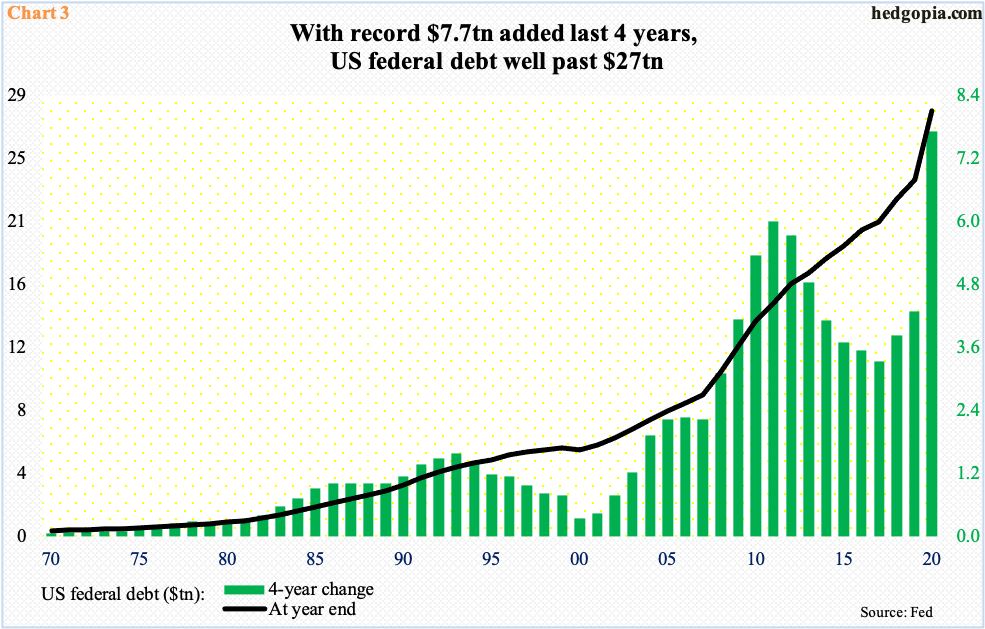
The federal debt has crossed $27.8 trillion – and galloping ahead. For reference, nominal GDP at 3Q20 was $21.2 trillion. Through that quarter, the debt-to-GDP ratio was north of one in 20 straight quarters and in 26 out of 28 quarters.
The pace of debt accumulation steepened as far back as 2008, with the curve going even more parabolic last year. In 2020 alone, $4.5 trillion in debt was added – the most one-year total ever. In all of President Donald Trump’s four years, $7.7 trillion was added – once again a record (Chart 3).
This is not going to get better anytime soon.
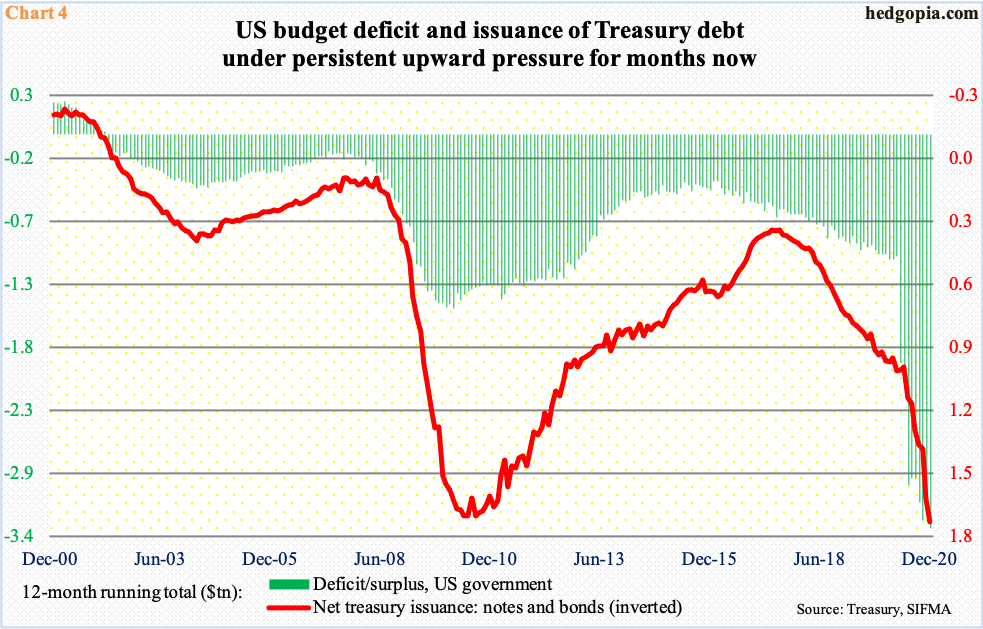
In the 12 months to December, the US government’s outlays exceeded receipts by $3.3 trillion – the highest red ink ever. President-elect Joe Biden has already announced a $1.9-trillion Covid relief plan. Plus, it is likely there will be some kind of an infrastructure package later on. This is one reason why growth forecasts have been revised higher.
As goes budget deficit so goes debt issuance. In the 12 months to December, the Treasury issued $1.7 trillion in notes and bonds. During that time, the Fed purchased $2 trillion worth of notes and bonds, and another $621 billion in mortgage-backed securities. As of last Wednesday, these assets respectively stood at $4.02 trillion and $2.03 trillion.
All this debt costs money. The math is simple. The higher the interest rate, the costlier it is for a borrower.
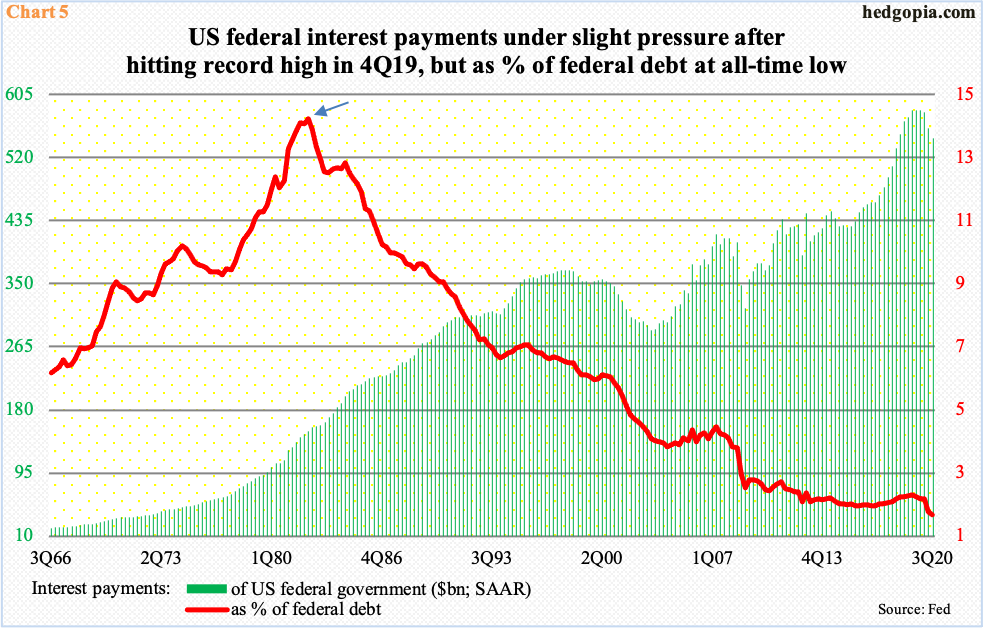
Back in 1981 when the fed funds rate peaked north of 19 percent and the 10-year yield north of 15 percent, the US government owed $1 trillion in debt (crossed that threshold for the first time in 4Q that year). Despite the manageable debt level, with a debt-to-GDP ratio of 0.32 in 2Q82, federal interest payments in that quarter were $150.9 billion (seasonally adjusted annual rate), which amounted to 14 percent of the outstanding debt (arrow in Chart 5). Then, as rates gradually came under pressure (notice the channel in Chart 1), the red line went from top left to bottom right, although the green bars kept rising. And rise they did.
As mentioned earlier, the debt pile is nearing $28 trillion. But it is being increasingly sold at cheaper rates. In 3Q20, interest payments were $546.5 billion, just below record $584.5 billion hit in 4Q19. But they only made up 2.03 percent of the debt load in 3Q20 – an all-time low. This is essentially an effective interest rate.
Therein lies the rub. Let us say rates were just a percentage point higher in 3Q20, interest payments would have gone up by $270 billion; two points higher, and we are talking $1.1 trillion in interest payments. This will hurt.
The picture is no different in the corporate world.
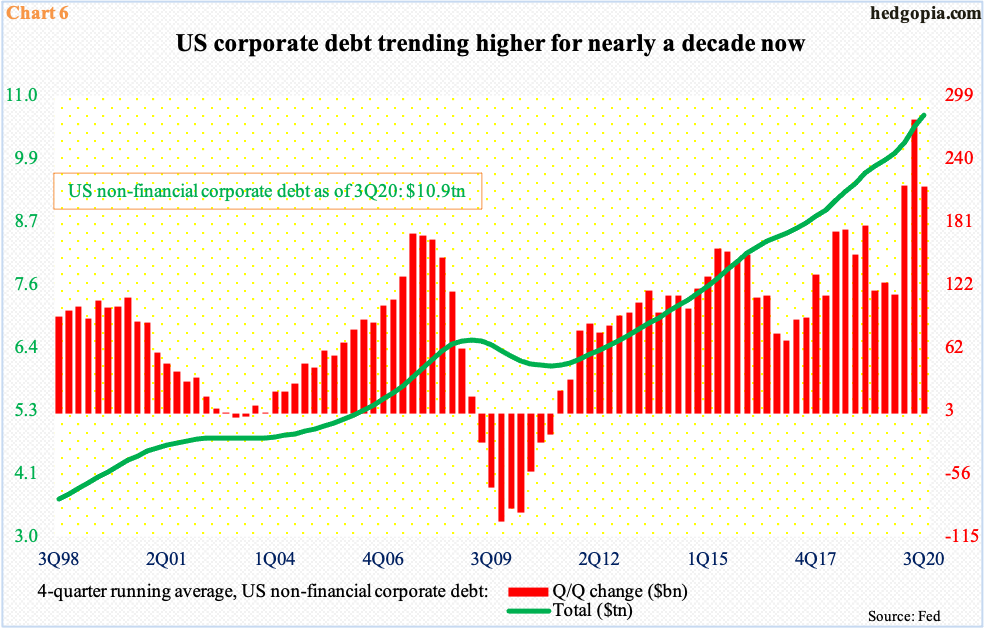
Non-financial corporate debt has trended higher for a decade now, with the curve steepening in recent years. Chart 6 uses a four-quarter average, and the uptrend is evident. On an absolute basis, debt was $10.9 trillion in 3Q20, up $857 billion in the first nine months last year and just a tad under record $11 trillion in 2Q20.
In March last year, the Fed announced it would start buying US investment-grade corporate bonds, which was extended to also include junk bonds in April. This sent a strong signal to the markets – that of a Fed put. Demand for these bonds subsequently went through the roof.
In 2020, investment-grade corporate bonds attracted $136.7 billion and high-yield funds $36.2 billion (courtesy of Lipper). Concurrently, corporate bond issuance totaled $2.3 trillion, up 60.1 percent over 2019; this was made up of $1.9 trillion in investment-grade and $421 billion in high-yield (chart here).
It does not take a brain surgeon to figure out what a sustained rise in rates would do to the financials of these companies.
The state of affairs is no less grim in the household sector. As of 3Q20, US households owed $10.8 trillion in home mortgage and another $4.16 trillion in consumer credit, among others. Rather encouragingly, they used some of the Covid stimulus checks to pay off their credit card bill (more on this here). As a result, consumer credit dropped from the record $4.2 trillion in 1Q20. That said, their balance sheet is stretched enough they would not be able to deal with progressively rising rates.
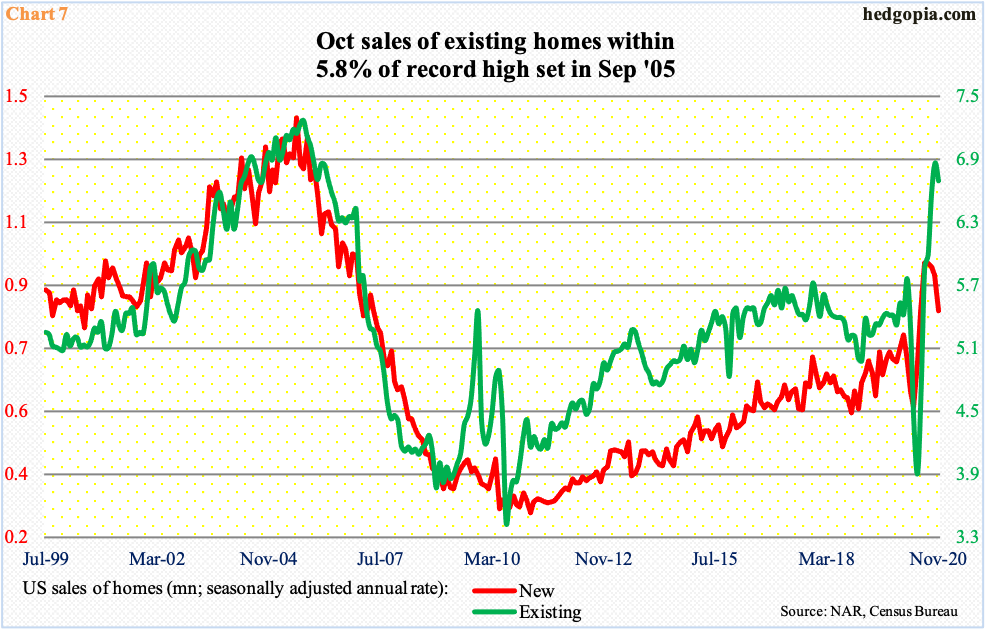
In fact, right here and now, there is another wildcard in play. The 30-year fixed mortgage rate was just under 2.7 percent at the end of 2020, a little over a full percentage point lower than a year ago. This has provided a massive tailwind to home sales, which took a nosedive in April and May last year but only to then recover with a V-shape in the following months. In November, sales (SAAR) of new homes reached 841,000 units and of existing homes 6.69 million, earlier having respectively reached 979,000 in July and 6.86 million in October. In fact, sales of existing homes in October came within 5.8 percent of the bubble high from September 2005.
The point is, as important as the sector is, housing desperately needs low – or lower – rates. Home inventory is very low. This helps the price, which, in turn, sets in motion the wealth effect, which the Fed is a fan of. In more ways than one, it is cornered. Yes, the balance sheet is elevated but in all probability is headed a lot higher. It is not even worth guesstimating how it all ends, and when. For now, low rates are here to stay, and the Fed will make sure things stay that way.
Thanks for reading!
