
Yet another fortnight and yet another show of strength by equity bulls. During the March 31st-April 15th period, the S&P 500 large cap index rallied one percent, the NYSE composite 1.5 percent and the Nasdaq composite 1.4 percent, among others.
Money flows continue to be tentative at best and negative at worst. Lipper data show $3.2 billion moved into U.S.-based equity funds in the week ended April 6th, followed by outflows of $4.8 billion in the following week. Net-net, $1.6 billion came out of these funds during the period.
That said, in the same two-week period, SPY, the SPDR S&P 500 ETF, did attract $2 billion (courtesy of ETF.com). Of other major ETFs, QQQ, the PowerShares Nasdaq 100 ETF, lost $549 million, and IWM, the iShares Russell 2000 ETF, pulled in $665 million.
Perhaps the biggest tailwind of all? Short interest – yet again.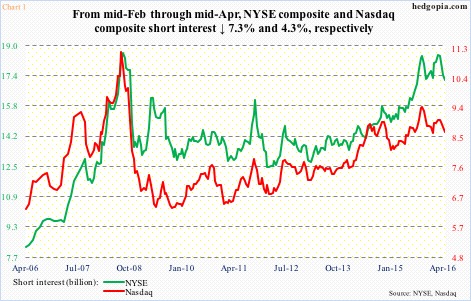
During the March 31st-April 15th period, both NYSE and Nasdaq short interest fell – by 1.5 percent and 1.9 percent, respectively (Chart 1).
U.S. stocks bottomed on February 11th. From the period ended February 12th, Nasdaq short interest is down 4.3 percent, to 8.69 billion. On the NYSE, it is down 7.3 percent, to 17.15 billion. Off that mid-February high, short interest has dropped for four consecutive periods.
Stocks have gone through the roof.
From February 11th through April 20th intra-day high, the S&P 500 rose just under 17 percent. This is not to suggest that short interest was the only catalyst here, but in the face of outflows/minimal inflows, short interest has helped – big time.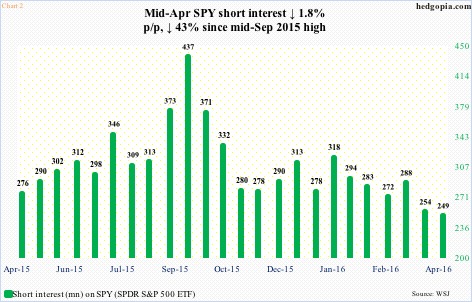
Chart 2 plots SPY short interest, which has absolutely collapsed since mid-September high. The mid-April reading is the lowest since end-March 2015.
This phenomenon is evident elsewhere.
Chart 3 shows a change in short interest on various ETFs over the last two months ended April 15th. The red bars translate to upward pressure on these ETFs, price-wise. While this suggests potential squeeze fuel is increasingly running dry, this is not the case on an index level.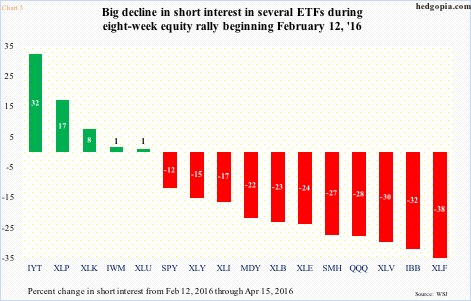
Short interest on both indices remains highly elevated (Chart 1), and in the right circumstances can continue to act as a self-fulfilling prophecy – upside pressure on indices leading shorts to cover, which in turn leads to upside price pressure.
Since April 15th through Wednesday close, the NYSE is up another 2.1 percent, although the Nasdaq is down 1.5 percent. This makes up for interesting dynamics, shorts getting squeezed in one and doing well in another.
Given the move stocks have had since February 11th lows, odds favor the Nasdaq is leading here, and other indices follow suit in due course. Shorts may just have the last laugh this time around.
Thanks for reading!
