- October 15th bottom in stocks forces shorts to cover in many sectors
- IWM expends lots of short-covering fuel to approach crucial resistance
- Nasdaq, NYSE short interest at multi-year highs, can bulls force squeeze?
Since stocks bottomed on October 15th, naysayers have essentially pooh-poohed the rally saying it is due to short-covering hence not sustainable. Well, there is some truth to that.
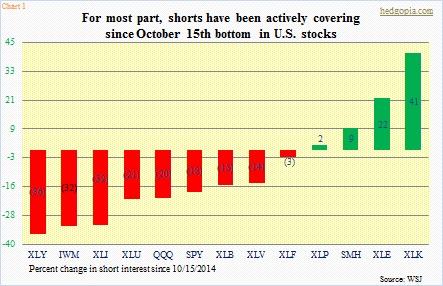
Chart 1 shows the percent change in short interest since that bottom through December 15th for various sector ETFs as well as SPY. It is obvious. Shorts have covered. In other words, they were getting squeezed. Of the S&P 500 sector ETFs, XLY saw the most decrease – down 36 percent; the ETF was up 10 percent during those two months. XLI saw a 32-percent drop in short interest, the ETF tacked on nine percent.
There are interesting signals coming out of IWM. Short interest on the small-cap ETF decreased 32 percent, and it rallied nearly seven percent. A big part of that decline (nearly 21 percent) came in the latest period (Nov 28th–December 15th), during which the ETF lost nearly three percent. That is a lot of short-interest fuel laid to waste. The past six sessions, stocks, including small-caps, have rallied, and it is possible more IWM shorts have covered. We will find out when the current period is reported in two weeks. For small-cap bulls, here is an important point to consider. At 106mn, short interest is down from 173mn at July-end and is the lowest in at least the last seven months. This even as the ETF (119.76) is literally sitting on crucial, multi-month-long resistance. We can look at it two ways. (1) Shorts deciding to cover even as the ETF nears this resistance can be viewed as a sign that they expect a breakout. And (2) shorts having covered already means a breakout would require genuine buying. Fingers crossed.
Another sector ETF to see a nice drop in short interest in the latest period was XLF (down 10 percent). The ETF fell two percent during the period, reflecting strength in the first half of the period and weakness in the second. This is true across the board. Stocks were strong in the first week of December, before coming under pressure in the second. This also shows that shorts were not adding to their positions even though stocks were weakening. Once again, this could mean (1) they did not want to get in front of the Christmas-rally freight train, and (2) the availability of short-squeeze fuel is less than what could have been.
Rather not surprisingly, Chart 1 shows a 22-percent buildup in short interest in XLE. At 66mn, short interest is highest in at least the last seven months. If and when oil turns, this can amount to genuine fuel for potential squeeze.
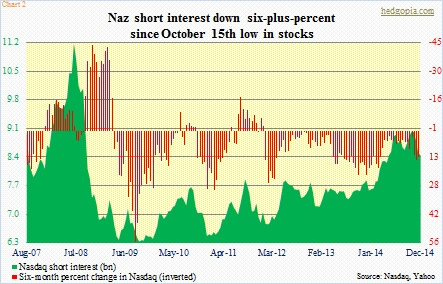
The only sector ETF that has seen a noticeable increase in short interest is XLK. Strange given QQQ and SMH both saw a decrease. Ditto with the Nasdaq Composite – down six-percent to 8.4bn (Chart 2). The index rose nine percent during the two months. Short-covering must have helped. Bears argue that a short-covering rally lacks sustainability. Fair point. Here is the thing, though. On the Nasdaq, the mid-October high of 9bn was the highest since end-September 2008. As the chart shows, there has been a persistent buildup in short interest. And this has consistently helped create a floor in stocks as shorts rush to cover.
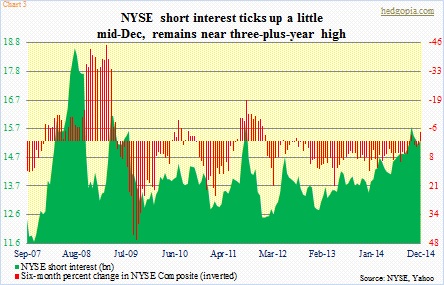
The NYSE Composite is the same (Chart 3). Short interest is three percent off the mid-October high of 15.8bn, which was the highest since end-September 2011. This is potential fuel, if – a big if – bulls can muster strength and force a squeeze. This may be asking for a little too much, but we will see.

