
In investing, November 9, 2016 will be remembered not only because a day earlier the nation chose Donald Trump as the next president of the United States but also because the way investors reacted to the news. Early weakness was bought in that session. In fact, overnight futures were much weaker earlier, only to gradually reverse higher.
Since the election, the S&P 500 large cap index is up 29.9 percent, the Dow industrials 40.2 percent, the Nasdaq composite 42.9 percent, and the Russell 2000 small cap index 30.5 percent.
Investors clearly bought into Trump’s campaign promises to cut taxes, reduce regulations, increase infrastructure spending, among others, some of which have already come to pass. Progress has been made in cutting regulations, and taxes have been cut.
Because there are three more years left in the current administration, if and when investors begin to change sector allocation will be a tell as to if they are rethinking their thesis. Thus far, there is not a whole lot of change.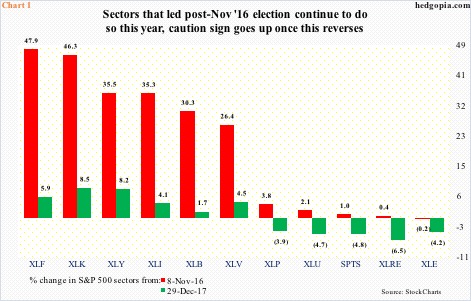
Chart 1 shows percent change in 10 SPDR sector ETF’s plus SPTS (S&P 500 telecom services sector index) from two dates – November 8, 2016 and December 29, 2017. The latter hence represents year-to-date performance.
The six sectors on the left side of the chart – XLF (financial), XLK (technology), XLY (consumer discretionary), XLI (industrial), XLB (materials) and XLV (health care) – have been the real winners since the election. Year-to-date, this more or less has continued.
The five sectors – XLP (consumer staples), XLU (utilities), SPTS (telecom), XLRE (real estate) and XLE (energy) – on the right are all down this year. The middle three in particular tend to be interest rate sensitive. Rates have backed up quite a bit, hence, one can argue, their underperformance. However, they began to massively lag right after the post-election rally got underway.
One thing that jumps out in Chart 1 is that, except for XLV, the leading sectors post-election are offensive in nature, while the laggards are mostly defensive. This has particularly been a factor this year, as the laggards are lagging even more.
In Chart 2, offensive sectors have been represented by XLB, XLK and XLY, and defensive by XLP, XLU and XLV. The red line, which ground higher post-election, has gone parabolic since stocks reversed higher on the 9th this month. This kind of performance/allocation is exactly what equity bulls would like to hear. Although this risk-on behavior is missing elsewhere.
Chart 2 also plots a ratio between the S&P 500 and the Russell 2000. Small-caps are regarded as risk-on. Because they are inherently domestically focused, they are also supposed to benefit more from cuts in regulations and taxes. Yet, they have been lagging their large-cap brethren right since the election.
Unless the green bars in Chart 2 begin to meaningfully rise, Chart 1 hence is worth watching. The caution sign goes up once the leaders begin to swap places with the laggards.
Thanks for reading!
