
For the first time in a while, equity bears may be looking at an opening. Bulls Wednesday defended nearest support on major US equity indices, but breach risks are rising.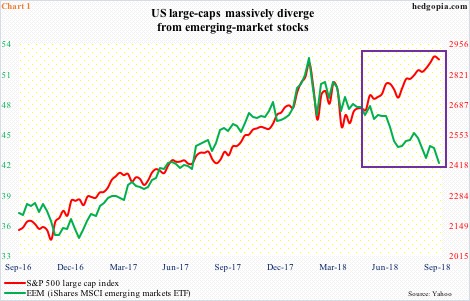
Kudos to the bulls who this year have withstood many a challenge thrown their way – from rising rates to trade tensions to persistent selloff in emerging-market currencies.
In fact, the S&P 500 large cap index and EEM (iShares MSCI emerging markets ETF) began diverging four months ago, and it has kept widening (Chart 1). For the year, the S&P 500 is up eight percent, versus a decline of 11.5 percent for the ETF. That is a swing of nearly 20 percent in a pair that normally tends to move in tandem – at least directionally.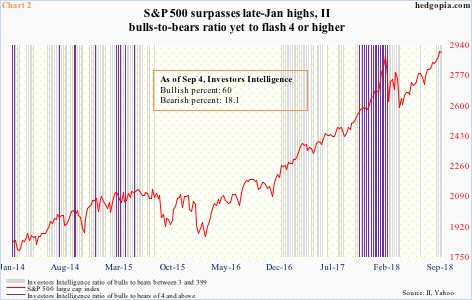
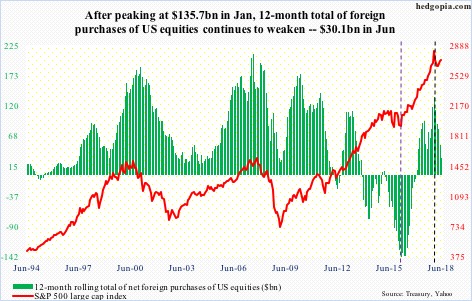
US stocks pulled off this feat in the face of record corporate buybacks. In 1Q, S&P 500 companies purchased $189.1 billion worth of their own shares. The pace likely continued in 2Q. Flows were o.k., though. Through Tuesday this year, three S&P 500-focused ETF’s – SPY (SPDR S&P 500 ETF), IVV (iShares core S&P 500 ETF) and VOO (Vanguard S&P 500 ETF) took in $345 million (courtesy of ETF.com). That is it! QQQ (Invesco QQQ Trust) did better, with inflows of $4.8 billion. Ditto with IWM (iShares Russell 2000 ETF) and IJR (iShares core S&P small-cap ETF) that combined gained $4.6 billion. Separately, US-based equity funds (including ETF’s) year-to-date attracted $5.9 billion. These are decent numbers, but nothing out of the ordinary. Through July this year, even FINRA margin debt is only up $10 billion, to $652.8 billion, with $668.9 billion in May a record. In 2017, margin debt jumped $113.4 billion. Concurrently, foreigners have been net-selling US stocks. Through June this year, they sold $35.6 billion worth, versus purchases of $118.9 billion in all of 2017.
The point is, except for buybacks, most sources of funds are mediocre to downright negative. This is kind of reflected in investor sentiment. Leading up to late-January highs in US stocks, sentiment was effusive. Using Investors Intelligence data, the ratio of bulls to bears back then remained at four or above for 17 consecutive weeks (including two readings of 3.95 and 3.99). The S&P 500, the Russell 2000 small cap index and the Nasdaq 100 index, plus several others, have all surpassed January highs, but sentiment is nowhere near (Chart 2). This fact by the way can be spun both ways to suit one’s own bias. Bears view this as longs having spent up all their energy. Bulls on the other hand argue there is more left in the tank. The latter better be right.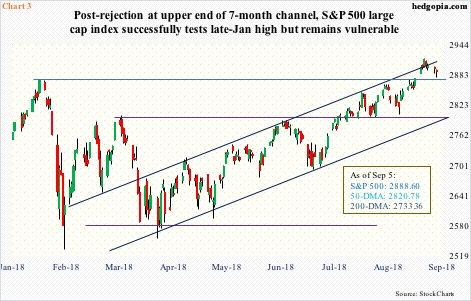
Several indices are at an interesting juncture. On the S&P 500 (2888.60), since defending breakout retest at 2800 three weeks ago, the index went on to post a new all-time high of 2916.50 Wednesday last week. That high also tested – unsuccessfully – the upper bound of a seven-month ascending channel (Chart 3). The index has come under slight pressure since. Wednesday, bulls stepped up to defend nearest support at 2870s; back in January, the S&P 500 retreated after hitting 2872.87. A loss of this support opens the door for eventual retest of 2800.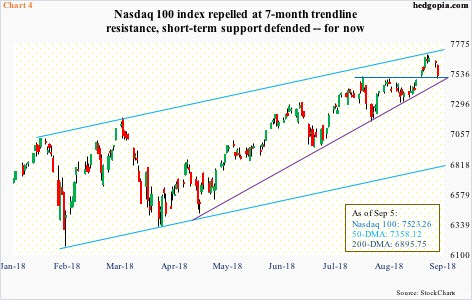
Similar dynamics are in play on the Nasdaq 100 (7523.26). Late January-early February, it suffered a quick double-digit decline (Chart 4). Then there was a similar drop in March. During this, the index printed higher highs and higher lows. The upper end of a channel thus born rejected the Nasdaq 100 late last month. Wednesday, support at 7500 was tested, and held. Right around there lies trend-line support from late April, a loss of which could accelerate move toward 7300.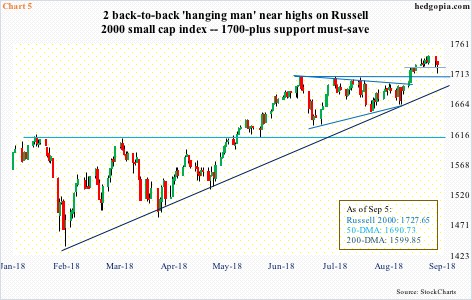
Over on the Russell 2000 (1727.65), 11 sessions ago it broke out of two-month resistance at 1710-ish. A measured-move target of this breakout lies at 1780s. Last Friday, the index rallied to 1742.09 intraday, before coming under pressure. Bulls are not giving up just yet. Both Tuesday and Wednesday closed in the red, but intraday weakness was bought, resulting in hanging man in both sessions. Wednesday also just about retested the most recent breakout – successfully. But odds favor the bull-bear tug of war eventually goes the latter’s way. The index remains overbought on nearly all time frame, and signs of fatigue are showing up.
On all these three indices, shorter-term averages have begun to at least go flat. The middle line of daily Bollinger bands (20,2) probably ends up deciding the near-term fate. They are yet to get tested in earnest but are nearby – 2866 on the S&P 500, 7481 on the Nasdaq 100 and 1709 on the Russell 2000. Selling will gain momentum once this support gives way.
Thanks for reading!
