Tech bulls only benefited in a minor degree from a major squeeze of non-commercials in the futures market. Concurrently, several other buying sources are increasingly acting hesitant.
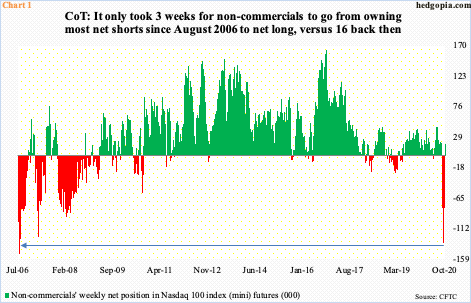
In the week to last Tuesday, non-commercials in Nasdaq 100 index (mini) futures made a big switch from outright bearish to modestly bullish. They liquidated all their net shorts and went net long, for a net increase of 92,881 contracts. They are now net long 17,868 contracts (Chart 1).
It is possible these traders decided to cover after the Nasdaq 100 pushed through the neckline of an inverse head-and-shoulders pattern six sessions ago. Last Monday, the index gapped higher; intraday, it was up 8.1 percent in merely four sessions, likely leading the shorts to turn tail. This at the same time means the potential fuel for short squeeze is all spent up.
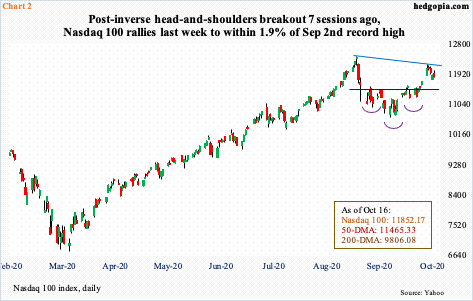
From last Monday’s high, the Nasdaq 100 then fell in the remaining four sessions (Chart 2). For the week, it was up 1.1 percent; at one time Monday, the index was up 4.1 percent. Bulls are probably not happy with the fact that all those net shorts are gone without much of a lift to the cash. From September 22nd when non-commercials were sitting on 134,311 net shorts, the Nasdaq is up six percent and was up 9.1 percent at Monday’s high.
The entire switch from net shorts to net long took place in merely three weeks. For comparison, in the week to August 1, 2006, when these traders were net short 151,506 contracts, the Nasdaq 100 closed at 1484.94. By the time they went net long liquidating all those net shorts – which spanned a total of 16 weeks – the index had rallied to 1808.88.
In many respects, Tech bulls probably view this as a wasted opportunity. They still hope to squeeze shorts elsewhere.
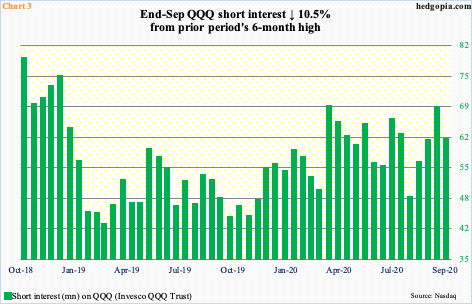
At the end of September, short interest on QQQ (Invesco QQQ Trust) fell 10.5 percent period-over-period to 61.1 million shares. Two months ago, at the end of July, this stood at 48.3 million (Chart 3).
More importantly, Nasdaq short interest remains massive. At the end of September, it increased three percent p/p to 9.76 billion – a 12-year high (chart here).
Time and time again, zealous shorts have ended up squeezed, providing a tailwind to indices such as the Nasdaq. But for one to unfold in the current circumstances, bulls need to be able to maintain the upward momentum, just so it becomes increasingly painful for shorts to maintain their bias. From bulls’ perspective, the risk going forward is weakening sources of buying power.
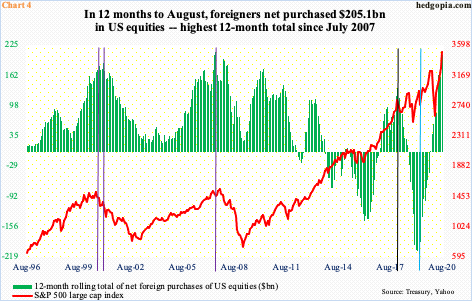
Foreigners have been aggressively gobbling up US stocks this year. In the 12 months to August, they purchased $205.1 billion worth. This is quite a reversal from April last year when they sold $214.6 billion worth – a record.
The problem is, their buying is beginning to get too lop-sided. August’s 12-month total was the highest since posting $210.5 billion in July 2007. The S&P 500 peaked in October that year, before collapsing 58 percent in the next 17 months (Chart 4).
Historically, foreigners’ purchases – or a lack thereof – and the S&P 500 go hand in hand.
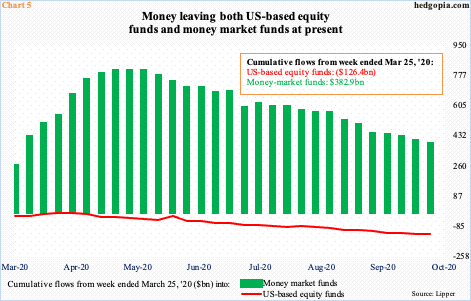
Bulls also had high hopes on stocks getting their fair share when money-market funds contracted. This has not happened yet.
In the week through May 20th, money-market assets reached an all-time high of $4.79 trillion. The S&P 500 bottomed on March 23rd; at the time, these funds held $4.22 trillion. Stocks bottomed, but money failed to leave these funds. This only began to occur in May. Since that high, $407.1 billion has left (courtesy of ICI). Not much has moved into stocks.
Lipper data show that from the week ended March 25th US-based equity funds lost $126.4 billion. Money-market funds have begun to decline but they are still up $382.9 billion from that date (Chart 5).
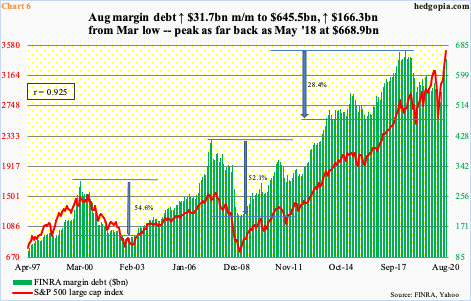
Margin debt is another metric that could potentially play a role here.
First of all, FINRA margin debt peaked as far back as May 2018 at $668.9 billion. Except for the Russell 2000, which peaked in August that year, other major US equity indices all kept making new highs, including the S&P 500 (Chart 6). Stocks were rallying hard, but the willingness to add to/take on leverage was missing.
Nonetheless, the latest trend has been encouraging. In March this year, margin debt dropped to $479.3 billion. From that low, it has gone up $166.3 billion, to August’s $645.5 billion. Bulls obviously would like this momentum to continue. September’s data will be out in a week or so and will be revealing. The S&P 500 peaked early that month and was down 3.9 percent for the month. From the perspective of risk-on sentiment, it would bode well if investors were willing to add to leverage in the midst of selling.
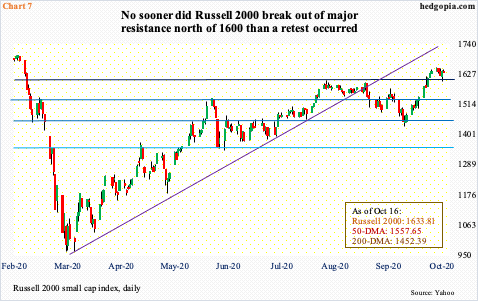
A similar risk-on message can come from the small-cap universe. The Russell 2000 (1633.81) is still below its August 31, 2018 record high of 1742.09. Right before the February-March selloff this year, the index traded in 1690s for several sessions. By the second half of March, it bottomed in 960s. The subsequent rally stopped on August 11th at 1603.60. Going back to January 2018, 1600-plus has proven to be a crucial price point for both bulls and bears. This resistance fell seven sessions ago (Chart 7).
This could prove to be potentially important, provided the breakout remains intact. A retest already took place last Thursday – successfully thus far. Small-cap companies inherently have more domestic exposure than their larger-cap cousins. How they behave can reflect on the state of the economy.
Post-breakout, the Russell 2000 rallied to 1652.05 before coming under pressure. Right here and now, it increasingly feels like longs will have a hard time building on the breakout. It is possible they will need to once again regroup at 1530s at best and 1450s-60s at worst. These levels are a must-hold.

All this trading action is unfolding even as the Fed once again is beginning to add to its balance sheet.
Early March, the central bank held $4.2 trillion in assets. By June 10th, this had ballooned to $7.17 trillion, which then dropped to $6.92 trillion within the next month, before rising to $7.15 trillion last week – merely $17.5 billion from a new high.
The recent momentum is evident in Chart 8, which uses a four-week change. At least beginning early September, which is when major indices peaked, stocks have pretty much treated the Fed action with a yawn. This can only discourage more risk-taking, particularly when the potential fuel for short squeeze is running dry – if not completely out.
Thanks for reading!

