
Complacency among equity bulls is growing but not extreme yet. With the S&P 500 ending last week right at the July high and breakout odds rising post-FOMC Wednesday, options-related sentiment readings can soon begin to flash red.
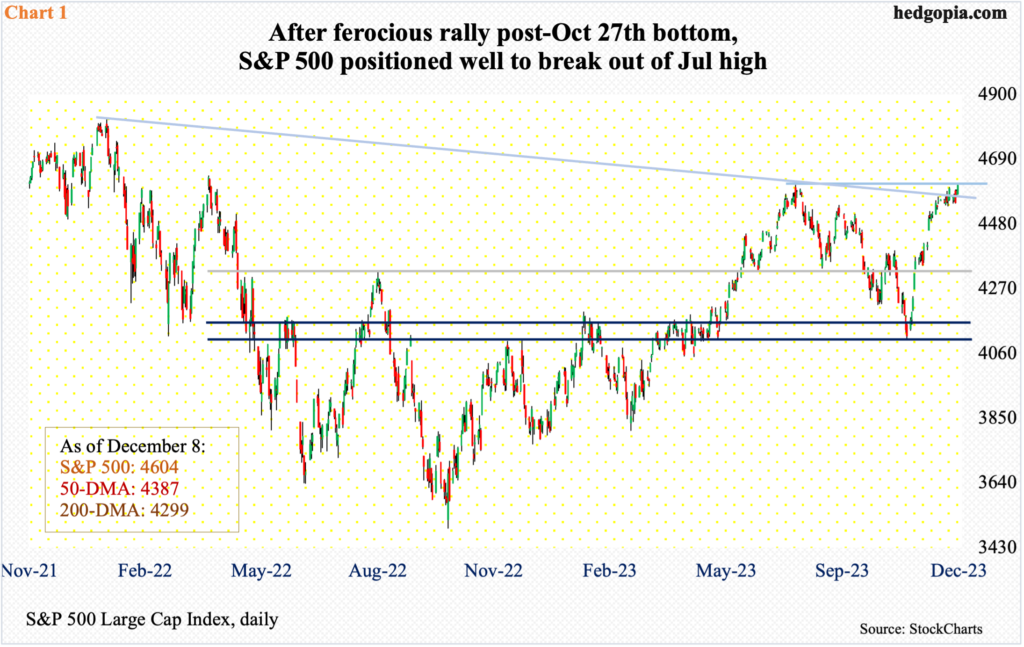
From July 27th to Oct 27th, the S&P 500 lost 503 points. Then from the October low to last Friday’s intraday high, the large cap index gained 505 points. For the bulls, it has been quite a ride the last six weeks – all of them up.
Last week, the bears drew the first blood, as by Wednesday the index was down one percent, but only for the bulls to come out swinging the last two sessions. When it was all said and done, the S&P 500 managed a 0.2-percent rise, ending right at the July high – 4607 (intraday) then and 4604 (4609 intraday) now (Chart 1). Back then, the S&P 500 reversed lower hard as soon as 4600 was crossed, ending the session at 4537. This time around, the bulls are staying put.
On Wednesday, the FOMC will let us know its interest rate decision. The policy-making body is going to leave the benchmark rates unchanged. That is a given. Also given is the fact that they are not going to say they have reached a terminal rate. Inflation has come down from last year’s four-decade highs but remains above the Federal Reserve’s two percent target. There is a chance the equity bulls will try – and manage – to spin the FOMC statement to suit their bias. In this scenario, the S&P 500 will break out, surpassing the July high and probably taking out stops.
Help can come from VIX.
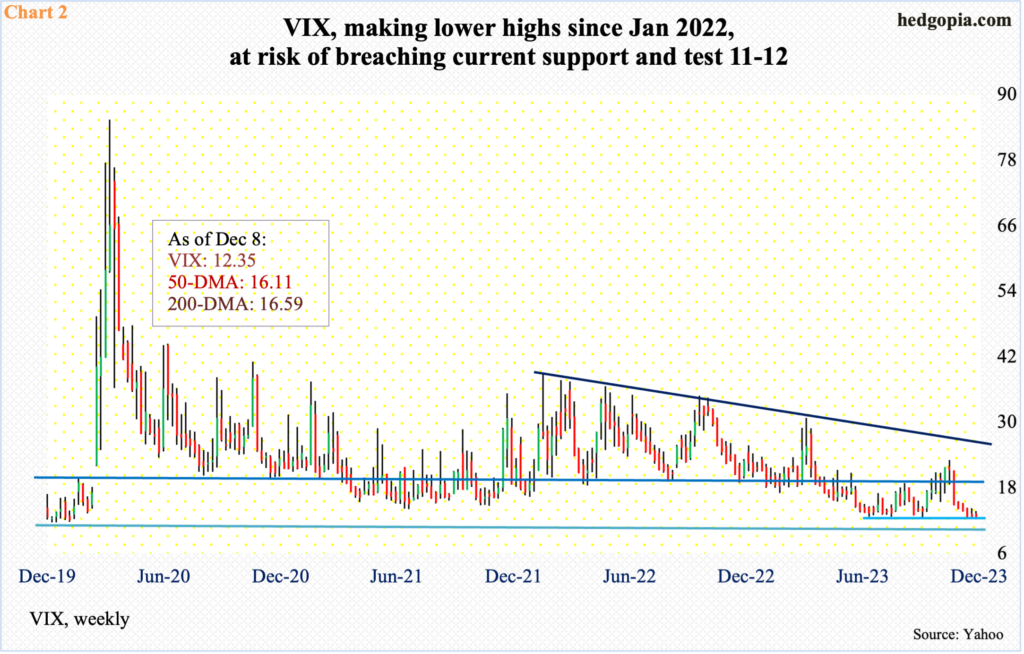
Last week, the volatility index gave back 0.28 point to 12.35, closing at the low. This was the lowest print since January 2020. In four of the five sessions, rally attempts were rejected at the 20-day moving average.
As things stand, VIX is clinging on to – or is in slight breach of – crucial horizontal support. VIX rallied in September and October, peaking at 23.08 on October 23rd. Prior to that, it found support at 13, or just south of it, in June through September (Chart 2). This level is being seriously tested. In fact, it has been slightly breached already, raising the risks the next level of support at 11-12 may just act like a magnet for now.
If things unfold this way in the sessions to come, the level of complacency currently evident in the markets will begin to flash red.
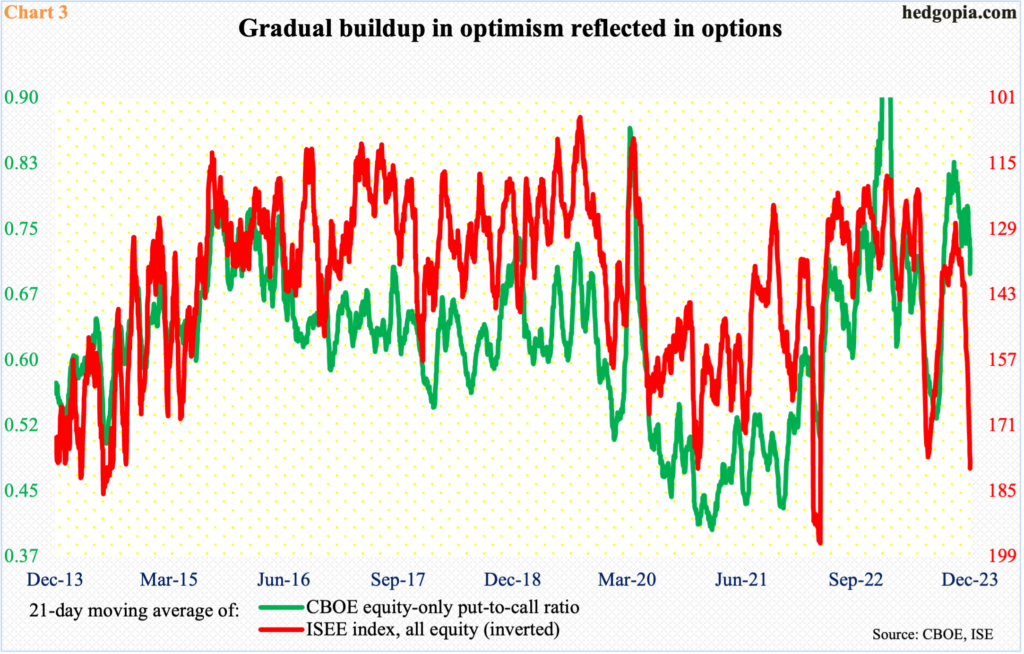
All through November and the first week this month, there has been a sustained buildup in optimism in the options market – evident in both the CBOE equity-only put-to-call ratio and the ISEE index. Unlike the former, the latter is a call-to-put ratio (hence inverted in Chart 3) and excludes trades from market makers and broker/dealers. In addition, it only uses opening long trades. So, from the perspective of sentiment reading, the latter is considered a clean number. Market makers, for instance, need to hedge exposure all the time. Retail traders on the other hand bet on direction.
Using the 21-day average, the ISEE index finished last Friday at 180.1 – the highest since April 19th last year – while at 0.699 the CBOE put-to-call ratio was the lowest since August 22nd this year. They are currently flashing yellow and could very well on the way toward the red zone.
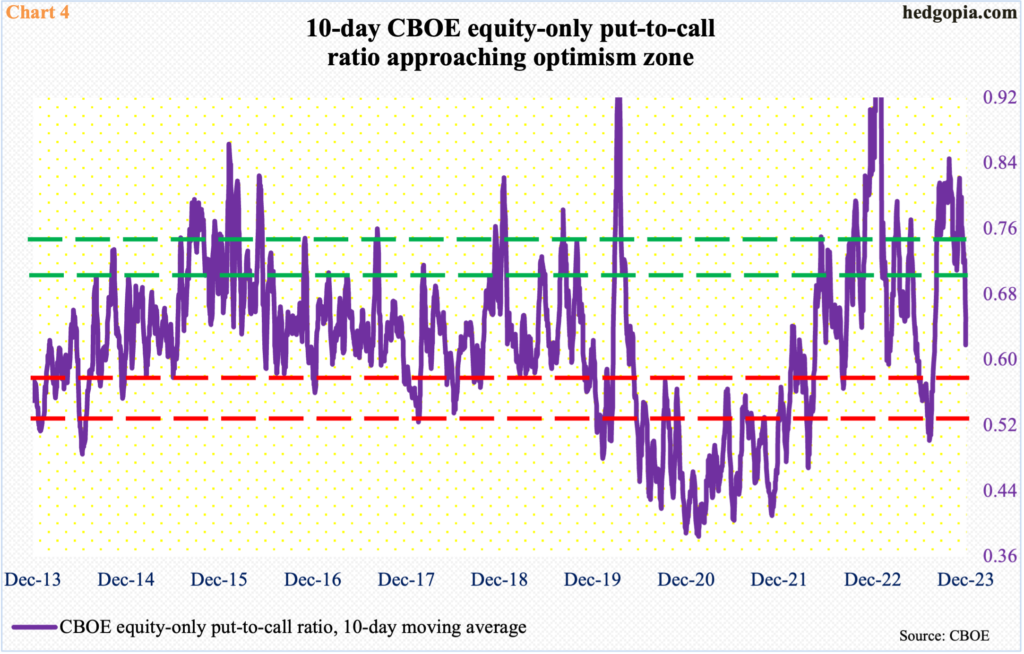
The CBOE put-to-call ratio has been in the 0.50s for six sessions in a row – and in seven of the last eight sessions. The 10-day average ended Friday at 0.618. There is a good chance by Tuesday it will have dropped to the high-0.50s – into the red zone (Chart 4). If the equity bulls pull off a rally on Wednesday post-FOMC, we are talking the mid-0.50s. Many a times in the past, the 10-day ratio has of course dropped into the 0.40s and even high-0.30s, but these are rare. Often, the ratio tends to turn up from the mid- to high-0.50s.
At the risk of oversimplification, excessive put buying can signal a bottom in stocks, while excessive call buying can signal a top. But this is not always so black and white.
An increase in put volume, for instance, may suggest retail traders are expecting a move lower, but they might very well be selling what they bought earlier. Or they might be deploying short puts or bull put spreads. Often, information can be gleaned from whether a trade is done at the bid or the ask, or from the way open interest has changed, but once again one large order can distort the picture.
Regardless, charts 3 and 4 are worth keeping an eye on, as they have consistently been a good guide to when complacency reaches the danger zone, or vice versa.
Thanks for reading!
