The following are futures positions of non-commercials as of March 3. Change is week-over-week.
10-year note: They continued to add to net shorts, and it has so far backfired. Post-jobs report Friday, the 10-year yield shot up 13 basis points. A huge daily move. For the week, the yield rose 24 basis points. The thing is, the 10-year is still trapped within a descending channel. A break out of here would be huge, no doubt. Looking at a weekly chart, there is room for that to happen. However, here is something to consider. Of all the U.S. economic numbers, the jobs data has clearly been surprising on the upside. But there have been several others that have surprised on the downside – factory orders being the most recent example. The most important data to come out next week is retail sales (Thursday), which is not likely to pull a surprise the way the jobs data did. Hence the odds next week of further downward pressure on notes/bonds as a result of stronger-than-expected macro numbers are probably not that high. The FOMC does not meet until the 17th-18th, even if we assume that a more hawkish signal is probable. In this scenario, that channel resistance should hold – at least next week. Currently net short 139.5k, up 29.8k w/w.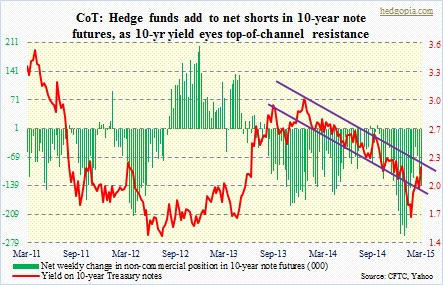
30-year bond: These traders obviously thought there was a risk holding these bonds going into the jobs report. They slightly went net short. They did not have enough exposure, nonetheless nailed the direction. As is the case with the 10-year yield, the 30-year is sitting at a crucial juncture. Resistance at 2.9-percent goes back more than three years. Further, the December 2013 downtrend line also converges right at that spot. Needless to say, a break here would be of immense significance. If that happens, it probably would not be next week. Currently net short 1.7k, down 10.4k.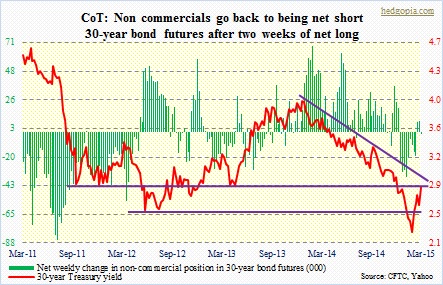
Crude oil: Net longs have continued to shrink. Still, they remain high. In a week that saw the U.S. dollar index surge 2.5 percent, the WTI essentially went sideways. You have to hand it to crude. Also, inventory has continued to build amid strong production. Yet crude holds up. Typically, these are all good signs. But storage remains a crucial factor. Given that oil is in contango, storage has played a major role in creating a floor for the price of crude. But storage is finite. As its availability shrinks, crude that is being stored now will have to find buyers. That is when the real test begins. Currently net long 277.1k, down 30.9k.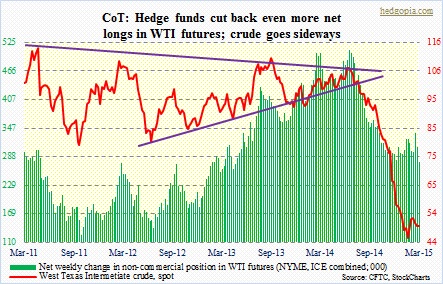
E-mini S&P 500: Perfect timing! For the first time in 14 weeks, these traders went net short. The S&P 500 large cap index had its first one-plus-percent weekly drop in five weeks – down 1.6 percent. Almost all of that came Friday, post-jobs report. In other words, stocks sold off on good news, which typically is bearish. It can be argued that the index was primed to sell off either way. As was pointed out last week, there was fatigue writ all over. The breakout two weeks ago was not able to draw in new buyers. In the process, it now has lost support at 2080-2100. Volume picked up Friday. The 50-day moving average is less than half a percent away from here. Bulls will probably not give that up that easy. The problem is, weekly indicators are beginning to roll over. It is still early, and not too late for bulls to regroup. But risk of selling pressure gathering momentum is rising. Currently net short 4.2k, down 28.4k.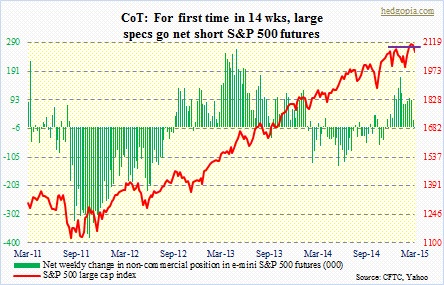
Euro: Well, that did not take long. FXE was unable to defend the 107 support discussed last week. Non-commercials have doggedly maintained their net euro shorts, and they have been rewarded. Before falling out of a rectangle it was in Wednesday, the ETF had gone sideways for five weeks. Once it fell out, stops got taken out in a hurry. The result is the ETF now sitting at 106.75. 110 is now resistance (111-112 on euro). Before that even gets tested, there is a long task ahead of base-building. That is assuming it has stopped going down. Big assumption. Currently net short 172.4k, down 5.3k.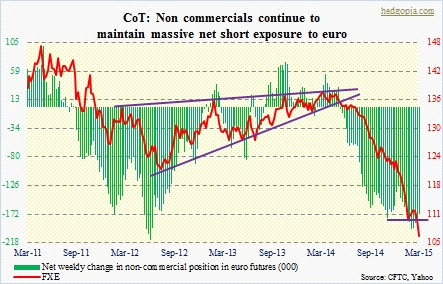
Gold: The metal lost 1,180. Last week, there were signs that this might happen. Intermediate-term indicators have now taken over, and they have more to go on the downside before they reach oversold territory. Looks like it is only a matter of time before the November 2014 low of 1,130 gets tested. Non-commercials continue to hold sizable net longs, but have been cutting back. Net longs are now 39 percent off the high six weeks ago. It is possible they already reduced this week. Gold dropped 2.5 percent on Friday reacting to the spike in interest rates, which was reacting to the jobs report. The metal sliced through 1,180. What gold bugs do not want to see is a hawkish message from the Fed on the 18th. Currently net long 115.8k, down 10.4k.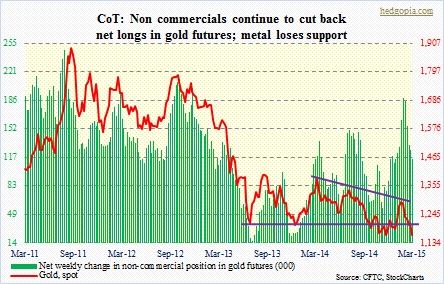
Nasdaq 100 index (mini): Non-commercials continue to have a bifurcated strategy as relates to the S&P 500 and the Nasdaq 100. In the former, they have now gone net short (though ever so slightly), while in the latter they continue to add. Net longs in Nasdaq 100 have tripled in four weeks. That has not been a bad strategy. For the week, the index was only down 0.9 percent – better versus both the S&P 500 and the Dow Industrials. And it is still above the level it broke out of three weeks ago – a little over a percent away. That area will be tested. No question about it. With AAPL not acting well leading up to Friday’s Dow inclusion announcement, bulls have a lot to prove. Currently net long 61.5k, up 7.1k.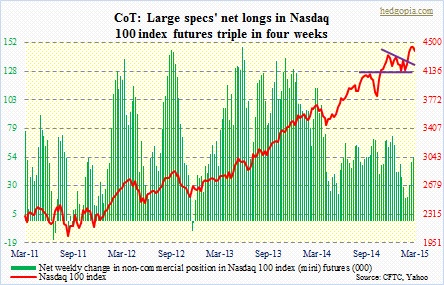
Russell 2000 mini-index: One of the constant memes that we have been hearing so far this year is that 2015 will be a year of small-caps. This blogger has not quite bought into that thesis, nonetheless has an open mind about it. So when the Russell 2000 broke out three weeks ago, it naturally ignited a lot of optimism among the believers. Except in one place. Non-commercials were not buying that breakout. For the past six weeks, they have continued to maintain net shorts in the 30k range. With the weakness Friday, the index has now fallen back into the wedge it was in. Weekly indicators have started to roll over. These traders will be rewarded for their dogged bearishness. Currently net short 30.8k, up 0.645k.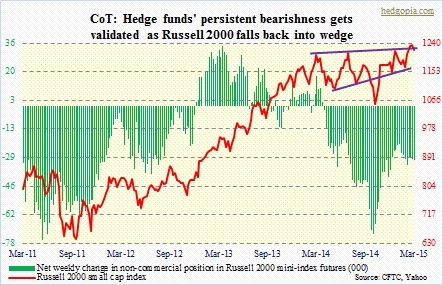
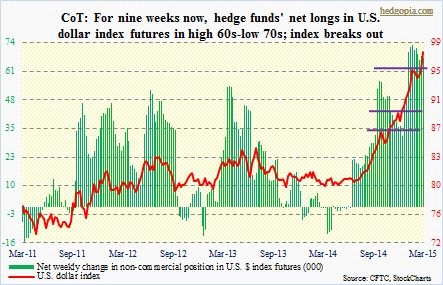
U.S. Dollar Index: Yet another resistance bites the dust. The 50-percent Fib retracement of the July 2001-April 2008 decline lied at 96.3. The dollar action the past couple of sessions – particularly Friday – took care of that resistance. Dollar bulls of course are now eyeing the 61.8-percent retracement, which lies at 102.2. Can it get there? Who knows, is the easy answer. Betting against the dollar since it began to surge last July has been a loser’s game. Yes, it is grossly overbought. Yes, it is a one hell of a crowded trade. But it does have one thing going for it – momentum. Which is intact. Dollar bulls have managed to persistently ignore negative news, which at the same latching on to positive news. Friday was a great example of the latter. Non-commercials have so far done a great job of riding the wave. Currently net long 67.2k, up 0.939k.
VIX: They really went for it this week, raising net shorts to the highest level in 13 weeks. Spot VIX, however, went the other way, and is probably not done going up. Since June last year, the spot has been making higher lows, and there is now a daily MACD crossover. The VIX to VXV ratio (not shown here) closed out the week at 0.87 (was 0.79 last week), and has a ways to go before it gets overbought. Currently net short 27.9k, up 21k.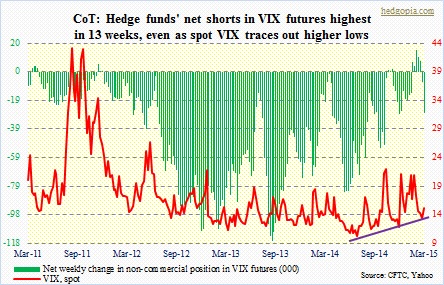
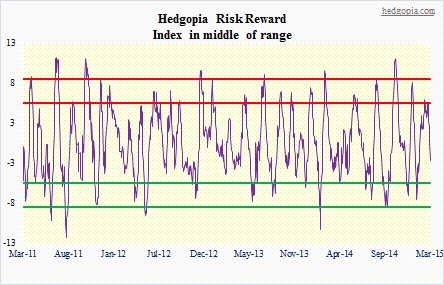
Hedgopia Risk Reward Index