The following are futures positions of non-commercials as of April 7, 2015. Change is week-over-week.
10-year note: Interesting times, indeed! Mexico this week issued a 100-year bond denominated in euros. This is not the first time that nation has tapped the global market for a century bond. In 2010, it sold its first 100-year bond, denominated in dollars, followed by one in British pounds a year ago. The fact that Mexico wanted to lock in lower rates for ten long decades is no news (for 4.2 percent yield-to-maturity). Who wouldn’t? What is news is the fact that there are willing buyers for this thing.
If you thought this was insane, wait till you hear this. Switzerland became the first country to have offered 10-year bonds with a negative yield. Just what signal are bond vigilantes trying to send?
One possibility is simply that the collective minds of the market expect deflation in outer years. Under deflation, real yields can be positive even though nominal yields are negative. Secondly, it is no news that several major central banks have been gobbling up bonds, forcing institutions such as insurance and pension funds to grab whatever comes their way. Or it may simply be a case of market participants trying to front run their central bank. Increasingly, it looks like there are not enough bonds out there for the ECB to meet its monthly QE quota of €60 billion.
In this light, is it any wonder that the 10-year U.S. Treasury yields just under two percent?
For a while, non-commercials have been on the wrong side of this trade. They added to net shorts during the reporting period, and were rewarded this time. The 10-year yield rose 47 basis points in the week. That channel support once again stopped the decline. If daily technicals prevail, there is room for it to rise further. The 50-day moving average is not that far away, and is beginning to gradually curl up.
Currently net short 162.4k, up 48.6k.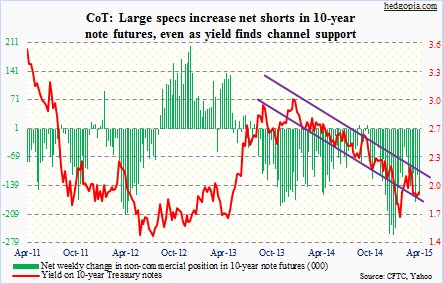
30-year bond: Investors are hankering for yields. The latter has been eluding them the past several years. Consider this. As of February, there were $134 billion in dividend-oriented ETFs, making up just under seven percent of $2 trillion in industry assets; of 99 dividend funds, more than half are less than five years old (courtesy of Morningstar). A sign of the times!
On the 30-year, the 2.5-percent support held, again.
What might next week bring?
The most important report in the economic calendar is retail sales (Tuesday), which have been a disappointment in recent months. Month-over-month, they have dropped for three consecutive months (Dec-Feb). Tuesday also brings the NFIB small business survey; between December and February, their comp plans have nudged down a bit – from 17 to 14. This series tends to lead average hourly earnings, even though there has been a breakdown in correlation of late. Housing starts is Thursday; February was a disaster – down 17 percent month-over-month to 897k (SAAR).
Even a slight improvement in these data points – and others – has potential to put upward pressure on yields.
Currently net long 13.8k, down 3.4k.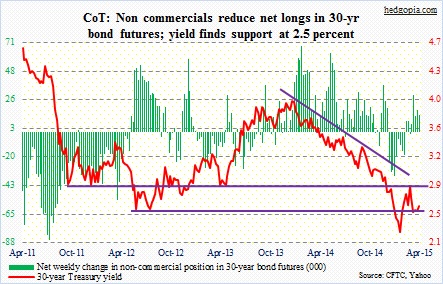
Crude oil: First thing first. Spot WTI once again tried to take out the 53-54 resistance, and was once again denied. This must be the 6th or 7th time this year (on a daily chart) that a rally attempt has been repelled by that price range. But the fact that oil bulls were even able to regroup and launch an attack is nothing short of impressive.
News was not all that rosy. The EIA fears that lifting trade sanctions against Iran could cut prices by $5 to $15/barrel in 2016. Here at home, Cushing, OK, tanks are at 83 percent working capacity (courtesy of the Schork report).
In March, Saudi Arabia produced a daily average of 10.3 million barrels a day – a record. Both Iraq and Libya managed to boost production in the month. Consequently, OPEC production was 31.5 million barrels a day, up 1.2 million barrels a day month-over-month and up two million barrels a day year-over-year.
Oil bulls are looking the other way. In and of itself, being able to rally, or not come under pressure, in the midst of negative news flow is always a positive. Maybe they are taking their cue from energy companies which are acting as if oil has seen its low. Job-cut announcements collapsed in March, following spikes in both January and February. Or maybe Royal Dutch Shell’s planned purchase of BG Group is viewed as a sign that the majors are beginning to see value.
Whatever it is, bulls had their share of negatives (failed breakout attempt) and positives (sideways move continues). A tough test lies ahead. Let us see if they can defend the rising 50-day moving average. By the way, the BG deal is motivated by natural gas, not oil.
These traders are optimistic. They have been adding to net longs the past couple of weeks.
Currently net long 287.8k, up 36.3k.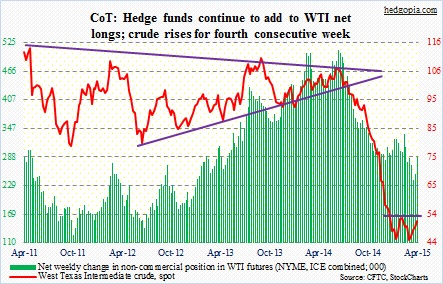
E-mini S&P 500: So bulls did step in to buy weakness. The March Jobs report-induced selloff on Monday attracted bids. For the week, the index was up 1.7 percent. Impressive, come to think of it! The earnings season did not quite get off to a great start, with AA failing to impress.
One of the allures to go long continues to be a low 1Q earnings bar to jump over. Plus, there was room for daily oversold conditions to unwind. And then there was this. Bill Dudley, president of the New York Fed, was scheduled to speak on Monday. Stock futures were deep in the red pre-open, before gradually improving. Here is a quote: “How fast the normalization process will proceed depends mainly on two factors: how the economy evolves and how financial market conditions respond to movements in the federal funds rate.” “How the economy evolves” is well understood. This falls within the Fed’s mandate. But “how financial market conditions respond to movements in the federal funds rate” once again brings into focus how the Fed thinks. The message seems to be, if markets cannot cope with higher rates, we will reconsider.
The S&P 500 in the process has managed to clear some hurdles, one of which is the convergence of the 20- and 50-day moving averages. On a weekly chart, several weekly indicators are about to turn up from the middle of the range. So bulls definitely have an opportunity to press for more gains. Technicians of late have been highlighting 2138 on the S&P 500, which is the 161.8-percent Fibonacci extension of the 2007-2009 decline. If the index crosses 2120, this has the potential to tempt on-the-sidelines traders.
Non-commercials are not buying into this scenario.
Currently net short 48.4k, up 13.4k.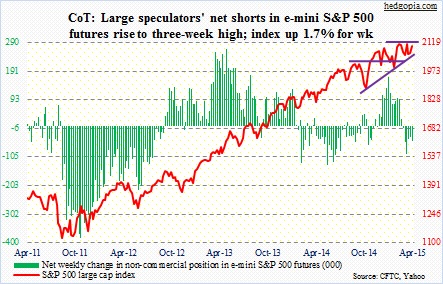
Euro: In four out of the five sessions, the currency ended in the red. Monday started with a bang, with a gap open, but the 50-day moving average, which is still declining, stopped the advance. That resistance was being tested for the first time since mid-December. Wouldn’t give in that easy. For the week, the euro was down just under three percent. There is room for more downward pressure next week. Let us see if March low (104.62) holds.
Currently net short 215.3k, down 11.3k.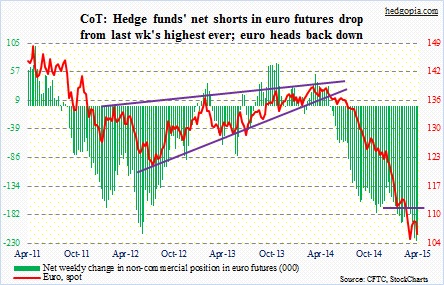
Gold: Optimism is growing among these traders. From the low three weeks ago, net longs have gone up 90 percent, though they are still substantially below end-January high. The good thing for gold bugs is that the metal rose this week in the face of strong dollar action (this was also true for oil). Nonetheless, it has not been able to bust out of the 1,240 range. So things continue to be range-bound.
If the metal continues to attract bids next week, its 200-day moving average will be in play (1,235), which can prove to be tough resistance.
Currently net long 100.8k, up 20.8k.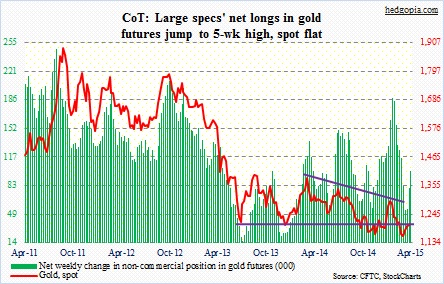
Nasdaq 100 index (mini): A new high in the cards for the index? Let us see if bulls can execute. They clearly have the ball right now. It was a strong week – up 2.5 percent. On QQQ, the 104 level was once again tested – successfully. Volume is a concern, but it is not a new phenomenon anyway. On a daily chart, there is now a bullish MACD crossover. Several technical indicators – both daily and weekly – have room to move higher.
Individually, AAPL has found buyers at/near its 50-day moving average. SMH, the semi ETF, just managed to poke its head out of the multi-month 52-56 range.
Bulls should be able to take advantage of all these favorable nods from market gods. It is theirs to lose. Non-commercials are staying optimistic.
Currently net long 59.3k, up 7k.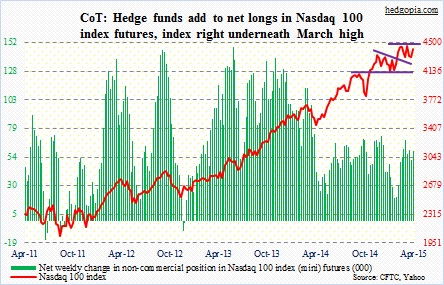
Russell 2000 mini-index: Small-caps lagged their large-cap brethren in the week. The R2K was only up 0.7 percent. Small-caps otherwise have been showing relative strength. This is probably why the ratio of RSP, the S&P 500 equal-weight ETF, to SPX ticked down in the week. The ratio has been trending higher, give and take, since late 2012. There are obviously many more small-caps than large-caps. So it helps when small-caps act well.
The Russell 2000 is right underneath its March high, and could very well be itching to break out.
These traders have substantially cut back their net shorts, which were as high as 40.7k a month ago.
Currently net short 13k, down 3.8k.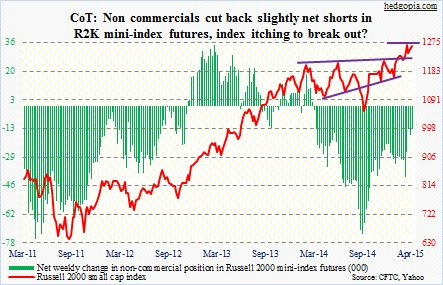
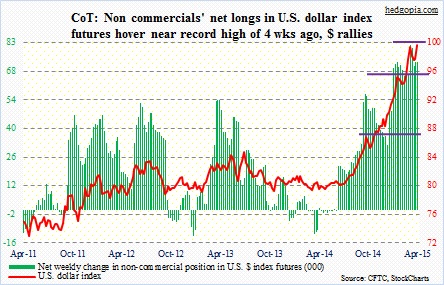
U.S. Dollar Index: Fundamentally, there was not much reason this week for the index to jump two percent. Was there? But there was, on the technical side. The spot made an intra-day low of 96.49 on Monday (the chart does injustice as it uses closing price), and then rallied strongly the remaining four sessions. Why did buyers feel confident to go long at/near that level? There are primarily four reasons: (1) lower range of Bollinger bands; (2) 50-day moving average; (3) horizontal support; and importantly (4) near the .236 retracement of the May 2014-March 2015 rally (95.6).
Next week can be interesting. If, for instance, March retail sales show consumers are finally spending, that has the potential to act as another tailwind for the buck.
By the way, for whatever it is worth, the FOMC’s dot plot suggests the Fed funds rate will reach two percent by the end of 2016! What might that do to the dollar, and then to U.S. exports and earnings of multinationals? One just wonders.
Currently net long 72.8k, down 0.3k.
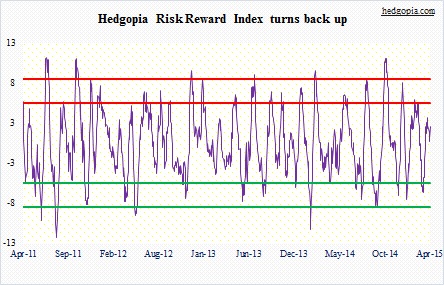
VIX: Bollinger bands continue to narrow, a phenomenon which normally tends to precede a sharp move, either way. The index shed two more points in the week, and is rapidly approaching multi-year support. So it is hard to imagine it coming under massive pressure. Although there is room for it to still go lower near-term. It is about to lose its nine-month trendline support.
So, when it is all said and done, the next major move will probably be on the upside.
Kudos to these traders for having caught the most recent downtrend. And they are pressing on the pedal. Net shorts rose to a 26-week high.
Currently net short 49.3k, up 5k.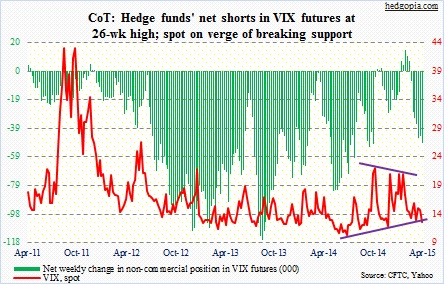
Hedgopia Risk Reward Index