The following are futures positions of non-commercials as of February 10 (Tuesday). Change is week-over-week.
10-year note: The 10-year yield tacked on another seven basis points for the week. Daily indicators are now grossly overbought. It is also right at its 50-day moving average. This is as good a place as any for bond bulls to resist. Is that why non-commercials further cut back net shorts in 10-year notes? From the highs seven weeks ago, their positions are now down 83 percent. Most of that was due to squeeze, as the 10-year yield continued to head lower. But the yield has risen the past two weeks, and net shorts have still dropped 63k since. Currently net short 44.8k, down 74k w/w.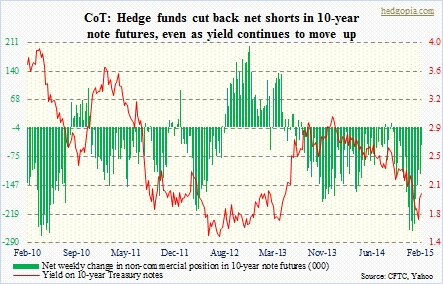
30-year bond: The 30-year yield rose 12 basis points this week – now up 40 basis points in two weeks. As is the case with the 10-year, the 30-year yield remains stretched near-term. But in a good market, overbought conditions can remain overbought for extended periods. As a matter of fact, that may very well be a sign of strength. The 30-year has taken out 2.5 percent. We will see what next week brings. In the meantime, these traders probably wish they had more net shorts. They started cutting back five weeks ago, but have been adding the past three weeks. Currently net short 18.6k, up 3.3k.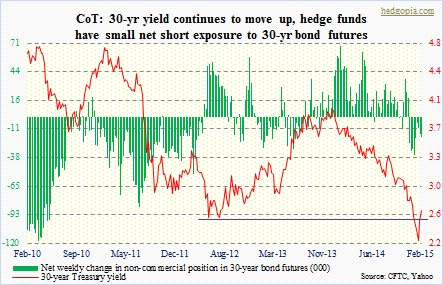
Crude oil: Contango continues to be deep. Crude oil six months out is selling for $59.28, one year out for $62.22. That is a lot of incentive for physical traders to buy spot, store and sell futures. If this is the only reason oil is attracting bids, then the rally is technical in nature. Soon, it will be arbitraged away. We will begin to get some sense this week as to if the rally has staying power. For the past nine sessions, WTI has been trading right underneath $53.50. Game changes if oil bulls can force a breakout, and stay above it. So far, price action is good, with good participation. Support at $47 has held for the second week. Non-commercials stayed put with their net long positions. They have maintained a relatively heavy net long exposure despite the collapse in crude. It is beginning to pay off. Currently net long 297.9k, down 1.6k.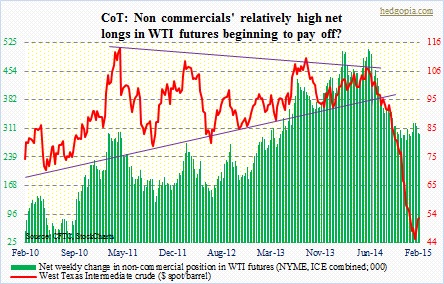
E-mini S&P 500: After bulls were able to retake the crucial 2000 and the 50-day moving average last week, they had another good week. The S&P 500 large cap index was up two percent for the week. In doing so, it has notched a new high and a breakout to boot – barely, though. There is room for previously oversold intermediate-term indicators to unwind further – means higher prices. This is what price action is telling us. From consumer discretionary (up 2.7 percent) to tech (up 3.8 percent), offensive sectors are leading. Consumer staples, on the other hand, was up less than a percent. And utilities finished down three percent. Nonetheless, large speculators, continue to act tentative. They are still net long, but substantially less than five weeks ago. Currently net long 97.5k, up 10.3k.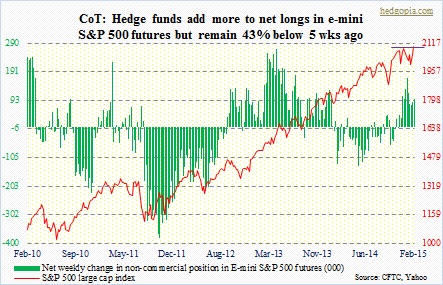
Euro: From the Jan 22nd low to Friday’s close, the euro is up two percent. That is 16 sessions we are talking about. One can argue it is essentially a sideways move. And this could very well be preparation for a sharp move. The euro looks coiled up. A 10-20 crossover is in the cards. Net shorts are simply massive, and could lead to a squeeze if the currency pushes higher. Greece is a potential catalyst. Non-commercials, however, have continued to maintain their substantial net shorts. By the look of it, they don’t seem to expect the Greek uncertainty to end (1) anytime soon, and/or (2) in favor of the euro. Currently net short 194.6k, down 1.7k.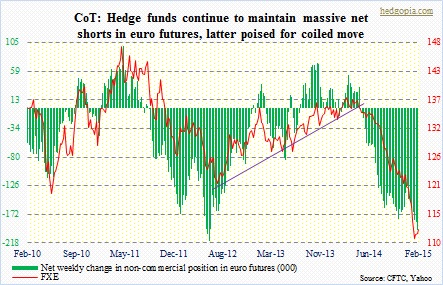
Gold: Gold acts weak. It was down 0.4 percent for the week. The weak dollar – down 0.6 percent for the week – was no help. Last week, the metal gave away 200-day. This week, it was 50-day. It seems destined to once again go test that 1180-1200 support. It is a must-hold. Gold is forming a descending triangle. More often than not, such triangles tend to break to the downside. Non-commercials are not convinced that is what is in gold’s future. They continue to hold a sizable net long position. Currently net long 155.3k, down 29.7k.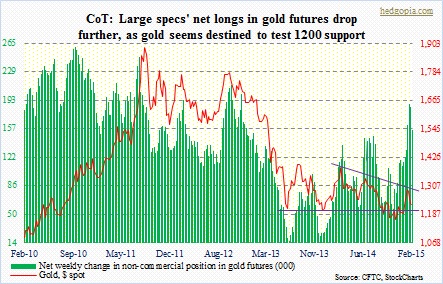
Nasdaq 100 index (mini): Speaking of a descending triangle, the Nasdaq 100 faced exactly one like gold. But it broke out of it. (So it can happen! Gold bugs sure hope the metal meets the same fate.) We had an inkling that this might happen when early this month for the umpteenth of time since mid-December the 4100 level was defended. AAPL of course was a disproportionate contributor – up nearly seven percent for the week. So it should continue to behave well. Other than that, there is room for NDX bulls to build on this week’s action. Non-commercials are not exposed enough. They started cutting back nine weeks ago, now have less than half of what they had back then. Currently net long 30.1k, up 10k.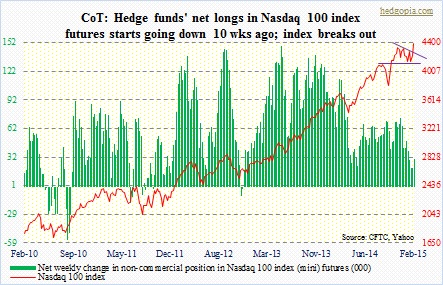
Russell 2000 mini-index: Finally! After nearly a year-long sideways action, the Russell 2000 small cap index breaks out. It is not a convincing breakout. Even so it is a new high for an otherwise lagging index. Before we start high-fiving and all, consider this. The index is still underneath a wedge. A push higher has the potential to draw in hitherto non-believers, one of which are non-commercials, who continue to maintain net shorts. Currently net short 28.7k, down 4.6k.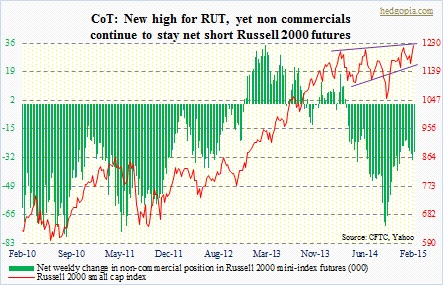
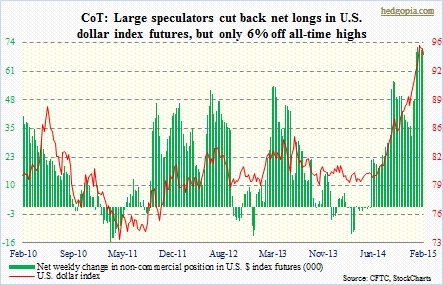
U.S. Dollar Index: The dollar is itching to go lower, the same way the euro is itching to go higher. The only question is duration. If weakness is short-term, then it is normal, given how overbought this thing is. If weakness persists in the medium-term, then the right side of the chart gives us an idea what could potentially lie ahead. The dollar has been such a crowded trade. The longer it stays weak, the higher the odds that these net longs will shrink. Are these specs feeling the same way? Too soon to say, but they did cut back some this week. Although in the big scheme of things, it is nothing – only down less than six percent from the high three weeks ago. Currently net long 68.9k, down 2.7k.
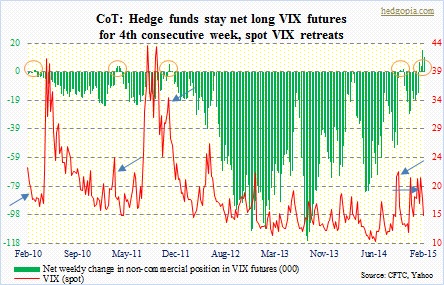
VIX: Large specs have stayed net long for the fourth consecutive week, and predictably, spot VIX has retreated five-plus points. Stocks are higher. This has happened before (orange circles and corresponding blue arrows). It is happening again. When it comes to VIX, these traders are a contrary indicator. Currently net long 10.5k, down 4.5k.