VIX acts like it wants to go lower for now. Concurrently, VIX:VXV is in overbought territory. And both the CBOE put-to-call ratio and the ISEE index point to growing investor pessimism.
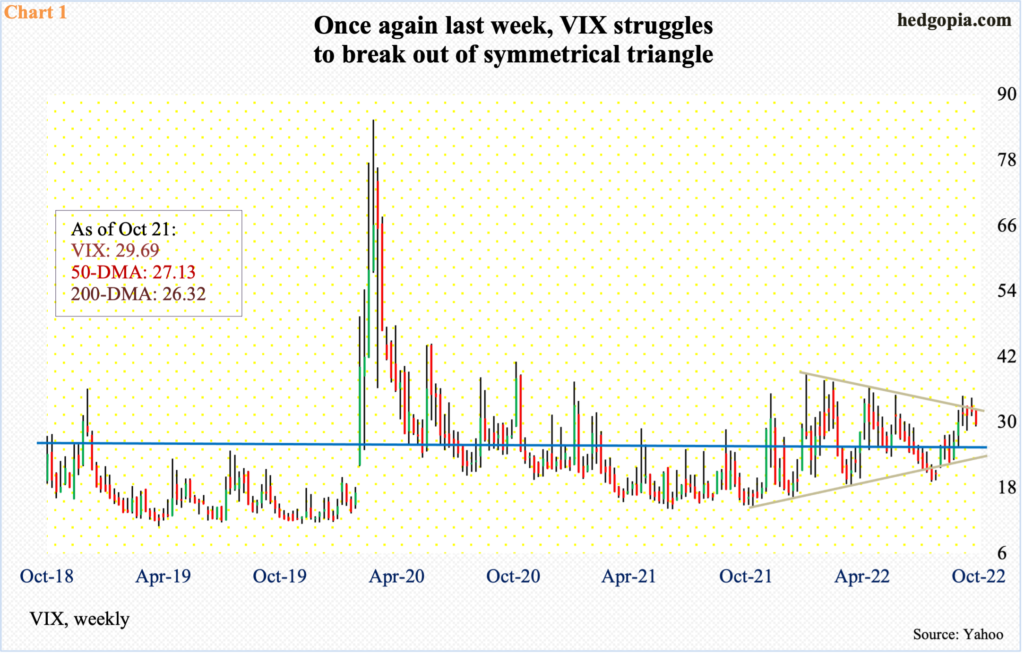
For the first time in four weeks, VIX went sub-30 last week, closing at 29.69. It could very well be itching to go lower for now.
Last week, the volatility index fell in four of the five sessions, with Wednesday’s only up session a shooting star.
Intraday, VIX rallied from 19.12 on August 12 to 34.88 on September 28 and has of late given out signs of fatigue. In the week before, two of the five daily candles comprised spinning tops, one ended with a long upper wick, one was a long-legged doji and one a large red candle.
For five weeks now, VIX has tried to break out of a symmetrical triangle, but to no avail (Chart 1). The lower end of the triangle lies between mid-20s and low-20s horizontal support. At least a test of mid-20s looks imminent; both the 50- and 200-day lie around there (27.13 and 26.32 respectively).
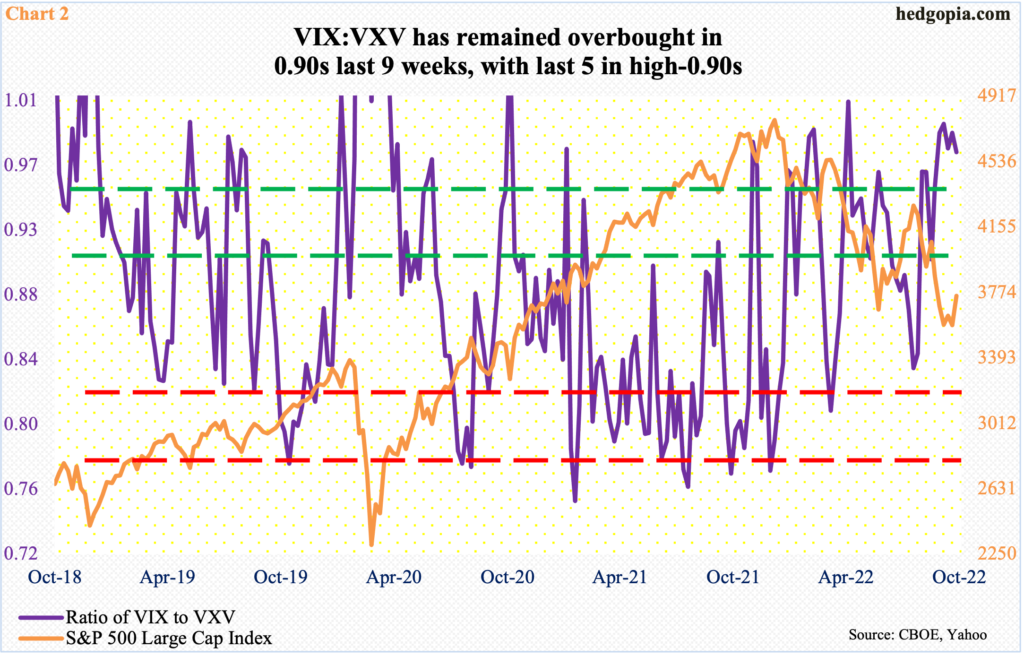
If volatility subsides as the 3Q earnings season advances and investor mood decidedly shifts to risk-on – duration and magnitude notwithstanding – demand for nearer-term protection should soften. This should lead to unwinding of the currently overbought ratio between VIX and VXV.
VIX measures market’s expectation of 30-day volatility on the S&P 500. VXV does the same, except it goes out to three months. When the investing environment is risk-off, demand for VIX is higher than, let us say, VXV. The opposite is true when sentiment improves.
Last Friday, the ratio closed at 0.97. This was the fifth week in a row VIX:VXV ended in high-0.90s – and ninth in 0.90s (Chart 2). This is overbought territory, meaning demand for nearer-term protection has remained elevated.
Once this begins to get unwind, VIX will begin to come under pressure.
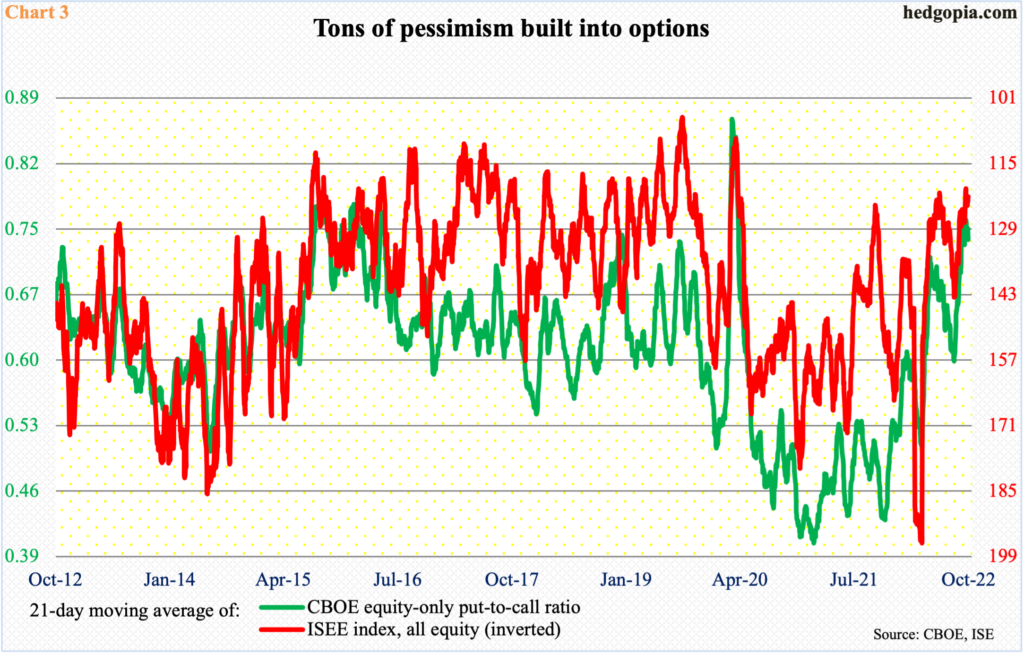
Similar dynamics are in play elsewhere. Activity in calls and puts are showing growing pessimism. This is evident in both the CBOE equity-only put-to-call ratio and the ISEE index.
Unlike the CBOE put-to-call ratio, the ISEE index excludes trades from market makers and brokers/dealers; it also only uses the opening long trades. From the perspective of sentiment reading, it is hence considered a cleaner number. Market makers, for instance, need to hedge exposure all the time. Retail traders on the other hand bet on direction.
Further, an increase in put volume, for instance, may suggest retail traders are expecting a move lower, but they might very well be selling what they bought earlier. Or, they might be deploying short puts, or bull put spreads. Often, information can be gleaned from whether a trade was done at the bid or ask, or from the way open interest has changed, but once again one large order can distort the picture.
With that out of the way, both the CBOE put-to-call ratio and the ISEE index encompass so many trades that they do get the direction right – sentiment-wise, that is.
Currently, using a 21-day moving average, they both indicate an elevated level of pessimism. The CBOE put-to-call ratio has been in the 0.70s since September 16, with as high as 0.756 on the 12th (this month). Similarly, the ISEE index, which is a call-to-put ratio hence inverted in Chart 3, fell as low as 120.3 on the 11th. Both metrics have not been this high or low – respectively – since April 2020.
At the risk of oversimplification, excessive put buying can signal a bottom in stocks, and vice versa.
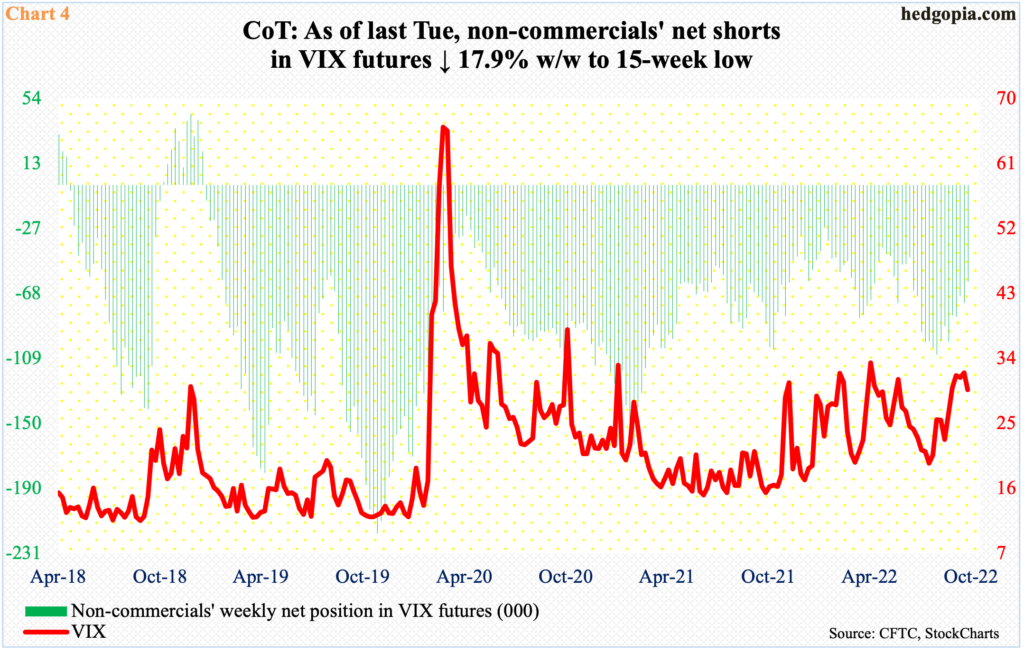
Interestingly, in the futures market, non-commercials have been actively covering their net shorts in VIX futures. They currently hold 60,797 contracts, down 17.9 percent week-over-week. In the week to August 23, they held 106,345 contracts (Chart 4). They have been right directionally, as VIX was just north of 24 on that date. As previously mentioned, it touched 34.88 intraday on September 28.
Traditionally, VIX tends to peak once these traders either go net long or get close. Viewed this way, VIX may not be done going higher at some point. Non-commercials’ latest holdings are as of Tuesday, so may have changed leading up to Friday when stocks rallied big.
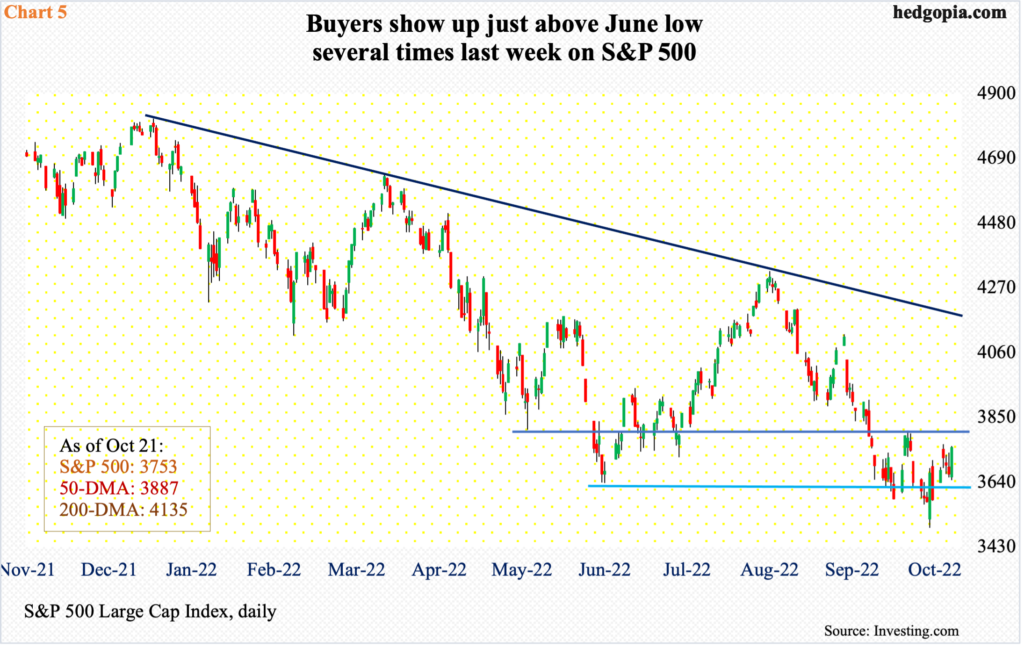
Last week, the S&P 500 jumped 4.7 percent to 3753, forming a marubozu, which was preceded by a spinning top in the week before and a shooting star before that.
From the low of 3492 on the 13th, the large cap index is now up 7.5 percent. Friday’s 2.4-percent rally was launched just above 3630s support, which was the low in June.
Immediately ahead, on condition that volatility cooperates, the index has room to rally to 3870s, which is also about where the falling 50-day (3887) lies.
Thanks for reading!

