
ETF.com carried a story on June 1 stating that U.S.-listed ETFs took in $32.7 billion in inflows in May. Year-to-May, a total of $203.8 billion came in. International equity ETFs made it big, as seven of the top 10 belonged in that category.
In the first five months this year, the trio of SPY (SPDR S&P 500 ETF), QQQ (PowerShares Nasdaq 100 ETF) and IWM (iShares Russell 2000 ETF), representing three major U.S. indices, cumulatively lost $10.5 billion, with SPY seeing redemptions of $8.8 billion, QQQ attracting $1.7 billion and IWM losing $3.4 billion.
But others did well. In the afore-mentioned Top-10 list, three are domestically-focused – IVV (iShares core S&P 500 ETF), VOO (Vanguard S&P 500 ETF), and VTI (Vanguard total stock market ETF). (IVV and VOO are SPY peers.)
IVV (assets under management, $112.5 billion) attracted $14.2 billion in the first five months, VOO (AUM $68.7 billion) $7.4 billion, and VTI (AUM $79.2 billion) $4.2 billion. They respectively held number 1, 6 and 9 spots in the Top-10. (SPY boasts AUM of $237.4 billion, QQQ $52.2 billion, and IWM $34.9bn.)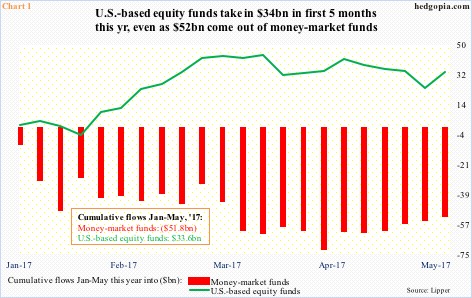
The positive trend of flows is also evident elsewhere.
Year-to-May, Lipper shows U.S.-based equity funds attracted $33.6 billion (Chart 1). In the corresponding period last year, they lost $77.2 billion. In the meantime, money-market funds lost $51.8 billion in the first five months this year.
In February last year, U.S. stocks reached an important bottom. The S&P 500 large cap index reached an intraday low of 1810.10 on the 11th that month. It is up nearly 35 percent from that low.
By March 2, 2016, U.S. money-market funds had swollen to $2.81 trillion (courtesy of ICI). From that peak through last Wednesday, they dropped $154 billion to $2.65 trillion. Not all of it went into stocks, of course. But a sizable portion likely did.
The general public is increasingly embracing the rally (in stocks, that is).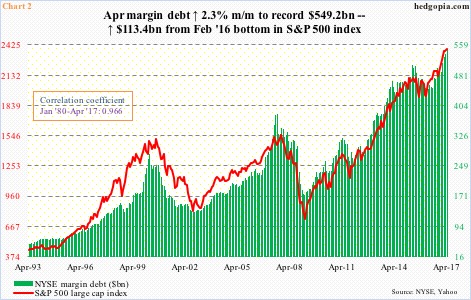
Take NYSE margin debt.
April posted yet another record, up $12.3 billion month-over-month to $549.2 billion (Chart 2). Since the low in U.S. stocks in February last year, margin debt has gone up by $113.4 billion.
Not surprisingly, the red line in Chart 2 goes hand in hand with the green bars. They have a correlation coefficient of .97 – nearly perfect.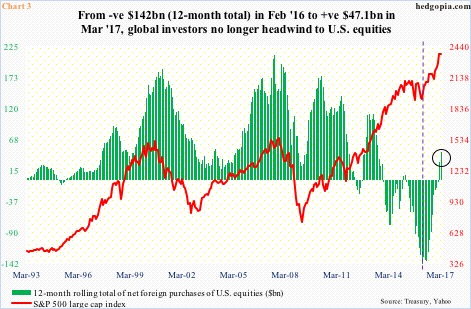
Even foreigners are on board U.S. stocks – finally.
In the first three months this year, they purchased $34.9 billion in U.S. equities. Chart 3 uses a 12-month rolling total, and on that basis both February and March were positive (circle). This was preceded by 23 consecutive negative months.
As early as February last year, foreigners were selling $142 billion worth (indicated by dashed vertical line in Chart 3). That was a record. The green bars started to improve from that month. The S&P 500 bottomed in that month.
Things have been in sync – foreigners buying, margin debt rising, ETF/fund flows in the green, and money-market funds in the red.
This has created enough of a tailwind to squeeze the shorts.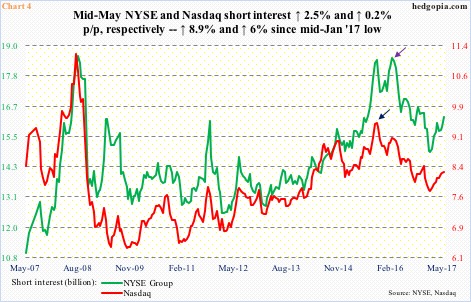
When U.S. stocks bottomed in February last year, NYSE short interest peaked at 18.5 billion in mid-February that year (indigo arrow in Chart 4). Nasdaq short interest peaked a little earlier – at 9.5 billion in September 2015 (blue arrow; mid-February 2016 was 9.1 billion). By mid-January this year, short interest dropped 19.5 percent and 18.1 percent from the highs, respectively.
This was a big tailwind to stocks.
From mid-January lows, short interest once again has been building – up 8.9 percent on the NYSE and up six percent on the Nasdaq. (End-May numbers will be reported this Friday.)
It is easy to see why shorts get tempted. From elevated valuations to eight-year-old economic recovery with decelerating momentum to a Fed caught between a rock and a hard place, there is a good fundamental case to go short. But this has not yet seeped into crowd-thinking. Hence the flood of flows.
At some point, shorts will be right. For that to occur, inflows need to stop/turn into outflows – be it domestic or foreign, or be it from savings or from borrowing.
From this respect, here is one for-whatever-it-is-worth data point. Going back to 2008, U.S. money-market funds never dropped below $2.53 trillion. As stated above, these funds held $2.65 trillion by the end of May. So it is getting close. That said, in the right circumstances for the bulls, they can still drop a sizable amount, by something like $100 billion.
In this scenario, what is already crazy in equities gets crazier.
Thanks for reading!
