
- Gold fails to generate enough buying interest near important support levels
- Despite oodles of central-bank printing, inflation remains a no-show
- 1,180 next line of sand, which is not too far away; must-hold
Remember the chart below? This was from Monday talking about how gold had technical spring in its step. Using last Friday’s price, it was above its 50-day moving average, a July trendline, as well as the crucial 1,180 level. The metal nonetheless was expected to come under pressure near-term as daily technicals were overbought. But as it turns out the price has weakened a little bit more than what could be considered a normal pullback.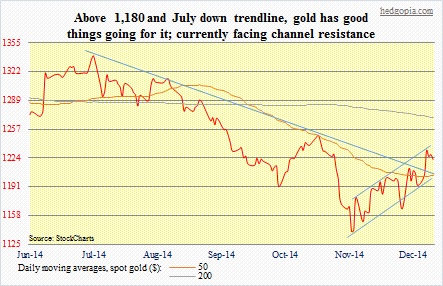
What changed? The chart below shows the same chart with three additional sessions added. And the difference is noticeable. Gold has not only lost the 50-day but also dropped back below that July trendline. To boot, since early November the metal had been rising within an ascending channel. Now that is gone, too. In a strong trend, buyers who missed an early run would be willing to step in around important support levels. The 50-day is one such level. And that was not defended.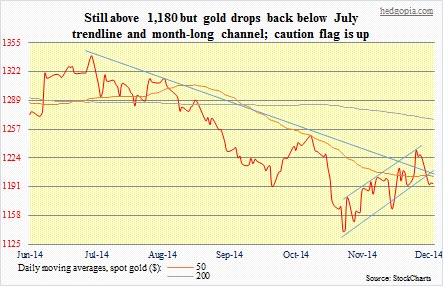
The good thing is, gold is still above 1,180 (1,189.20 as of Wednesday). But the failure to hold support raises a caution flag. It had an opportunity to break out of that channel last week, but obviously did not have enough energy left in it.
Yesterday, it tried to rally post-FOMC statement. It was slightly green when Chair Yellen took the podium, but then gradually sold off as she began to take questions. One of the things not working for gold has been a lack of inflation despite the amount of liquidity the Fed – and, of course, other central banks – has thrown into the system. Ms. Yellen kept repeating that the recent downward pressure on inflation is transient in nature. But the market does not believe her. As was discussed yesterday, five-year inflation expectations have continued to head lower. The disinflationary trend in the U.S. is also evident in the chart below.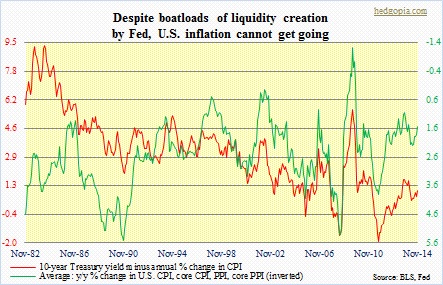
Since the September 2011 peak, gold has been in a downtrend, with several countertrend rallies. There were two decent ones last year – June and December. But they were not strong enough to stop the overall trend. Both of those times gold rose much more than what it has done thus far. Nonetheless, the way it is looking now it wants to go lower still. The 1,180 level is a must-hold. The dollar is a big wild card in this regard.
