Are markets beginning to subtly have doubts about the White House-proposed tax cuts passing Congress?
Large caps continue to trudge higher. The S&P 500 large cap index keeps rallying to one after another high. As overbought as it is – the 14-day RSI north of 70 for nearly three weeks now – momentum is intact. The last time the 10-day moving average was tested was late September this year.
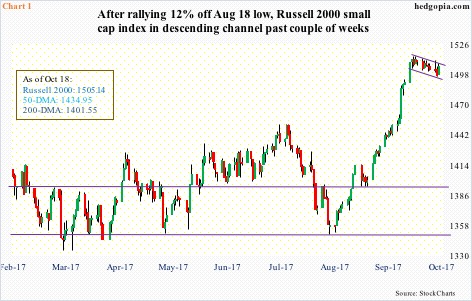
Until recently, this was also true with the Russell 2000 small cap index. Since peaking on October 5 at a new all-time high of 1514.94 after a parabolic run, it has traded within a slightly-falling channel with lower highs and lower lows (Chart 1). It just lost the 10-day.
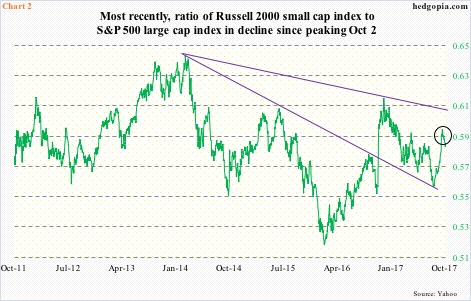
The ratio between the Russell 2000 and the S&P 500 is under pressure.
Most recently, on an intraday basis, the ratio essentially peaked on October 2, with a reading of 0.5968, followed by 0.5969 two sessions later (circle in Chart 2). Yesterday was 0.5877.
Post-presidential election in November last year, the Russell 2000 rallied strong, up 16.5 percent between November 9 and December 9, before going sideways. Then, between August 18 and October 5 this year, it again put up a strong showing, up 12.3 percent (Chart 1).
President Trump’s promises to cut taxes and regulations as well as increase infrastructure spending did wonders to improving investor sentiment toward small-caps. This was true during the November-December rally last year and true now. The start of the August-October rally coincided with the announcement by the White House of its tax proposal.
Now, small-caps are lagging – potentially an important development. Versus large-caps, small-caps inherently have more domestic exposure, and stand to get a bigger bang for a tax-cut buck, should one come to pass.
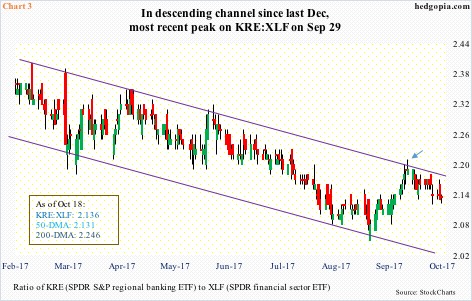
A similar message is coming from the ratio of KRE (SPDR S&P regional banking ETF) to XLF (SPDR financial sector ETF). It peaked at 2.423 on December 29 last year, and has since trended lower. The most recent peak came on September 29 (arrow in Chart 3).
In XLF, the top five account for 44 percent of the weight – Berkshire Hathway (BRK.b) 11.3 percent, JP Morgan (JPM) 10.8 percent, Bank of America (BAC) 8.1 percent, Wells Fargo (WFC) 7.5 percent, and Citigroup (C) 6.2 percent. These are all large entities, with JPM, BAC and C present globally.
In KRE, the top five only account for nearly 14 percent. Comerica (CMA) leads with 2.81 percent, followed by M&T (MTB) 2.77 percent, SunTrust (STI) 2.75 percent, CIT Group (CIT) 2.73 percent, and Citizens Financial (CFG) 2.72 percent.
In September, XLF (26.31) staged a major breakout – out of decade-old resistance at 25-plus. KRE (56.19), on the other hand, has been unable to take out eight-month-old resistance at 57.50. Most recently, it peaked at 57.40 on October 6, with the bulls losing the 10-day and struggling to save the 20-day.
Since they are both domestically focused, KRE and the Russell 2000 follow each other. Hence the importance of the message their relative underperformance is trying to send at this juncture. They rallied strongly on tax-cut hopes. Recent price action suggests at least some are beginning to question/doubt that.
Thanks for reading!

