
On major U.S. equity indices, buyers stepped up to the plate just where they needed to. Can they sustain it?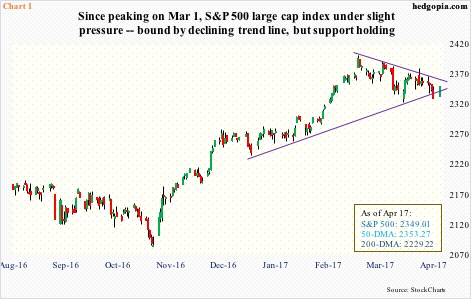
From peak to trough, after reaching an all-time high on March 1 (2400.98), the S&P 500 large cap index shed 3.3 percent. In the sell-off last week, the low on March 27 was never undercut – last Thursday came close (Chart 1). But the 50-day moving average was lost – the index has been under that for the past three sessions.
Since it peaked on March 1, the S&P 500 has also been trading along a declining trend line, which will be tested right around where its 50-day lies. It is merely 0.2 percent away. What happens here – followed by 2370 – will decide how things may transpire at least near term.
Speaking of which, volume was anemic yesterday – likely because traders are waiting to see what happens at that level.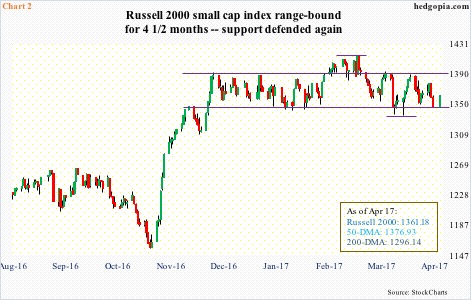
There are similar dynamics in play on the Russell 2000 small cap index. Range support was once again defended (Chart 2).
It has been four and a half months and counting. That is how long the Russell 2000 has been trapped in a range – between 1392 and 1347. Apart from a false breakout in February, selling resistance and buying support has worked like a charm, including this time.
Last Thursday, it essentially closed on support, which also approximated the lower daily Bollinger band. Should it continue to rally, resistance is stiff at the 50-day, which it tried to take out three times last week but was repelled. After that, of course, lies the upper end of the range.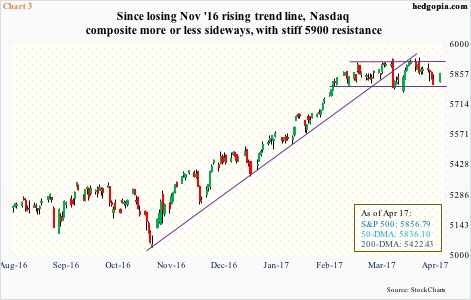
Of the three equity indices mentioned here, the Nasdaq composite was the first to recapture its 50-day. It lost that average last Thursday, only to reclaim it yesterday. Near-term support at 5800 was never lost (Chart 3).
In the past month and a half, the composite reached a new high north of 5900 three times – 5911.79 on March 1, 5928.06 on March 21 and 5936.39 on April 5 – and was unable to stay there all three times. It is 1.1 percent away.
Nasdaq volume yesterday was the lowest this year. Once again, either traders are in a wait-and-see mode – waiting to see what happens at resistance – or bulls are running out of ammunition. We will find out in due course.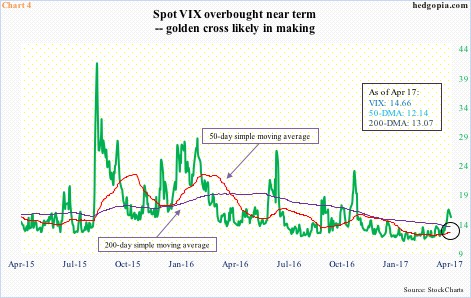
As things stand, compression in volatility can help the bulls near term.
Leading up to this week, spot VIX, from intraday low to high, rallied north of five points in seven sessions. In all four sessions last week, it closed above its rising upper Bollinger band. Grossly overbought on the daily chart, Monday produced a solid red candle.
VIX’s (14.66) path of least resistance is for it to go test its slightly-falling-to-flattish 200-day moving average (13.07). The rising 50-day rests at 12.14. The way things are proceeding, a golden cross is in the making – likely in the next couple of weeks (circle in Chart 4).
Near term, assuming VIX proceeds to unwind its daily overbought conditions, this should coincide with the afore-mentioned indices testing their respective resistance.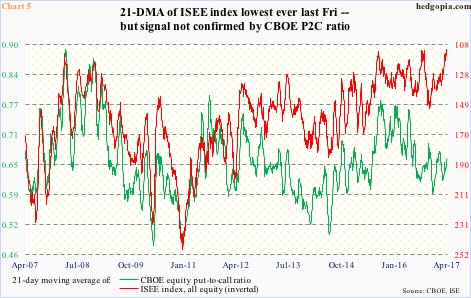
In fact, a signal coming from the options market bodes well for the bulls.
The ISEE index has tons of unwinding left. The 21-day moving average reached the lowest ever last Thursday (110.7, and rose to 111.6 yesterday).
Unlike the CBOE put-to-call ratio, the ISEE index is a call-to-put ratio (hence inverted in Chart 5), excludes trades from market makers and brokers/dealers, and only uses opening long trades. Hence, from the sentiment perspective, it is considered a clean number. Market makers, for instance, need to hedge exposure all the time. Retail traders on the other hand bet on direction.
The problem is, this signal is not confirmed by the CBOE P2C ratio. In general, the two tend to move together, but have diverged this time around.
For now, VIX probably is the one to watch.
Thanks for reading!
