
Two weeks after breaking out of 1250s, the Russell 2000 (1233) is back below it. IWM shorts never bought into the breakout. They were probably driven more by the sharp deterioration in small-business profit trend. Longs will be on the back foot should 1170s fall.
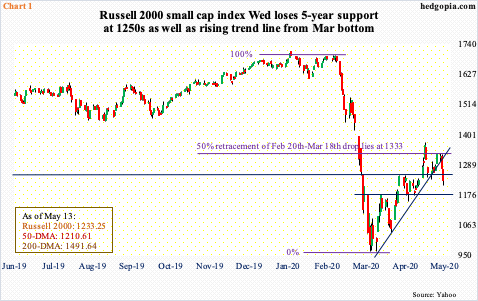
The Russell 2000 small cap index (1233.25) is back below 1250s. The straight-line support goes back five years. The 7.2-percent drop so far this week also pierced through a rising trend line from the March bottom (Chart 1).
Earlier, after breaking out of 1250s late April, the Russell 2000 rallied to 1373.39, but staying above it proved difficult. At 1333, it retraced 50 percent of its February-March collapse during which the Russell 2000 tumbled north of 43 percent in 20 sessions.
By being able to push the index back below 1250s, bears may be sniffing blood. If in the sessions ahead bulls try to go after that broken support-turned-resistance, shorts are likely to put up a good fight.
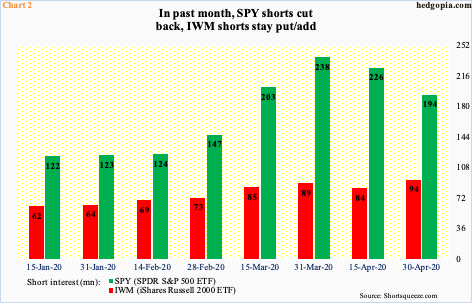
In more ways than one, this represents a wasted opportunity for longs. There was room for short squeeze. At the end of April, short interest on IWM (iShares Russell 2000 ETF) rose 11.7 percent period-over-period (Chart 2). By contrast, SPY (SPDR S&P 500 ETF) short interest dropped 14.2 percent in that same period.
In fact, SPY short interest is down 18.6 percent in the past month, even as IWM shorts have been gradually adding this year. Large-caps have led small-caps for a while, including from the March lows. Shorts getting out of the way helped SPY/S&P 500 index, and tech in particular (more on this here). Small-cap bulls did not benefit from this phenomenon. Shorts staying put probably speaks of their conviction.
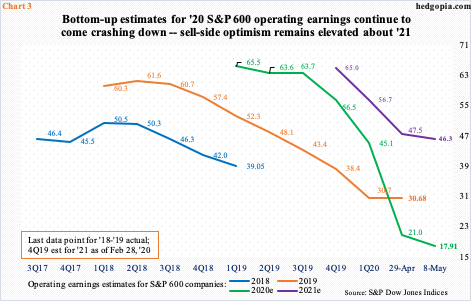
Small-cap bulls have not gotten much help from earnings. As of Thursday last week, 1Q20 blended earnings estimates for S&P 600 companies were minus $3.03. When the quarter ended in March, the sell-side was expecting $8.07. That is quite a delta. Consequently, the consensus now expects $17.91 for this year. This was $45.09 at the end of March and much higher early last year (Chart 3). By the way, these analysts still expect earnings to soar 159 percent next year to $46.30.
From the revision point of view, the trend is downward for S&P 500 (large-caps) and 400 (mid-caps) companies as well, with 2020 estimates having dropped from $157.91 at the end of March to $113.03 and from $100.57 to $62.90, in that order (not shown here). That said, it is only the S&P 600 where 1Q20 estimates have swung into negative territory.
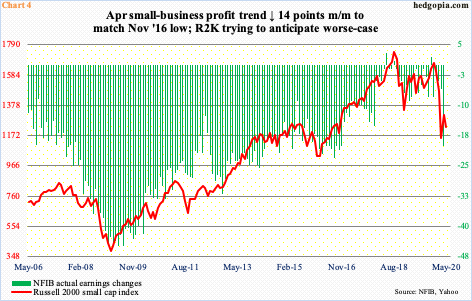
The deteriorating picture is also reflected in small-business profit trend.
The NFIB’s ‘actual earnings changes’ sub index tumbled 14 points month-over-month in April to minus 20. This matches the low of November 2016, but, if past is prelude, the worse probably is not over.
For some perspective, in 2009, the metric hit minus 44.90 in four different months. In the prior two recessions, it tagged 27.20 in June 2001 and 30.20 in June 1991. The Covid-19 recession has the potential to be worse than the 2008-2009 financial crisis. In this scenario, the green bars in Chart 4 are not done going down. Historically, the Russell 2000 follows along. This is what small-cap shorts are eyeing. They have done a good job of reclaiming 1250s and will have strengthened their odds should 1170s fall.
Thanks for reading!
