
Small-caps have rallied nicely year-to-date. Supposedly, they benefit the most from last December’s tax cuts and are also considered insulated from negative effects of a trade war. They now sit at critical technical juncture.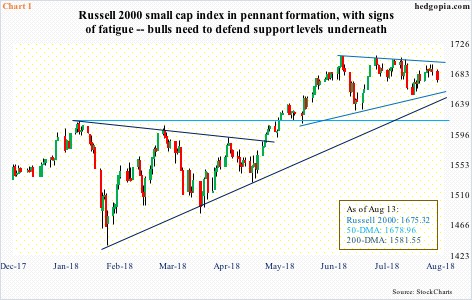
Over the last eight weeks, the index has been denied at 1700-plus three times – 1708.10 on June 20, 1708.56 on July 10 and 1706.83 on July 24. Monday, it initially tried to rally some but closed the session down 0.7 percent, losing the 50-day moving average in the process. In the meantime, bulls have consistently stepped up to buy at higher lows. As a result, a pennant has formed. This preceded a rally, thus the current consolidation could very well be a continuation pattern, in which case ultimately the index will break to the upside. At least the bulls hope so. There was a similar formation in January-May this year, which ultimately resolved to the upside (Chart 1).
Year-to-date, the Russell 2000 (1675.32) is up 9.1 percent. This compares with rallies of 15.7 percent for the Nasdaq 100, 5.5 percent for the S&P 500 large cap index and 1.9 percent for the Dow Industrials. Large-caps are lagging. Small-caps – rightly or wrongly – are benefiting from investor perception that these companies’ domestic focus would largely insulate them from the adverse effects of a trade war. There is also a perception that small-caps benefit the most from last December’s tax cuts. The risk the bulls face at this point is that whoever wanted exposure to the sector is in already. If so, the current consolidation may not necessarily result in an upside breakout.
The index remains overbought on nearly all time frame, hence the significance of several support levels underneath – 1665 (June trend line), 1640 (January trend line) and 1615 (horizontal support). The latter also approximates trend-line support from February 2016 (blue channel in Chart 4).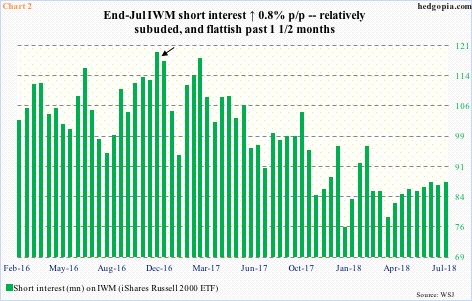
When small-caps bottomed in February 2016, short interest on IWM (iShares Russell 2000 ETF) was elevated. Later, post-presidential election in November that year, shorts got even more aggressive (arrow in Chart 2), which ended up providing a reliable tailwind to the ETF/Russell 2000 as these shorts got squeezed. Right now, short interest is suppressed – relatively, of course. At the end of July, short interest inched up 0.8 percent period-over-period to 87.1 million shares – flat in the past month and a half.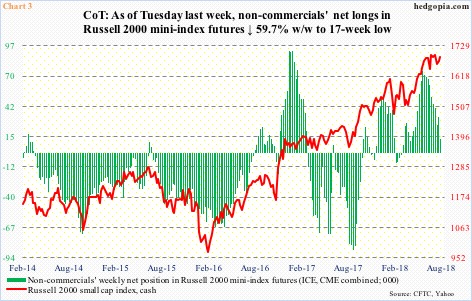
Along the same lines, non-commercial futures traders have been cutting back net longs in Russell 2000 mini-index futures. In the week ended last Tuesday, they held 13,211 contracts, versus 74,239 at the end of May. In the week to June 19, they were still holding 67,483 contracts, before reducing exposure. As mentioned earlier, a day later the cash for the first time rallied north of 1700 but only to go sideways to slightly down since. These traders tend to be trend followers. So it is interesting to see them cut back, even as the Russell 2000 is sideways to slightly down. Or, it is possible they are eyeing Chart 4.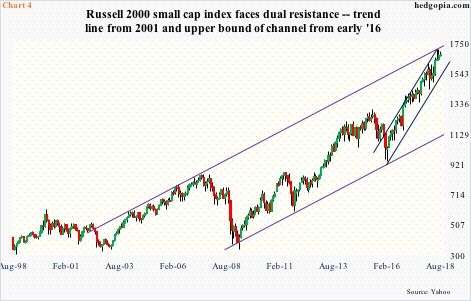
On the monthly chart, both June and July produced candles with long wicks. This having come after a ferocious rally can be a tell. Time will tell. We know this much. The Russell 2000 is currently bumping against major trend-line resistance – going back to 2001. It is also facing resistance at the upper bound of a rising channel from early 2016.
As things stand, odds favor this resistance does not give way anytime soon. More important perhaps is if the bulls will be able to save the support levels mentioned earlier (Chart 1).
Thanks for reading!
