Small-caps are showing some improved action. With so many false dawns in the past, bulls hope this lasts and that the economy is headed for Goldilocks, as too hot or too cold may not suit their bias.
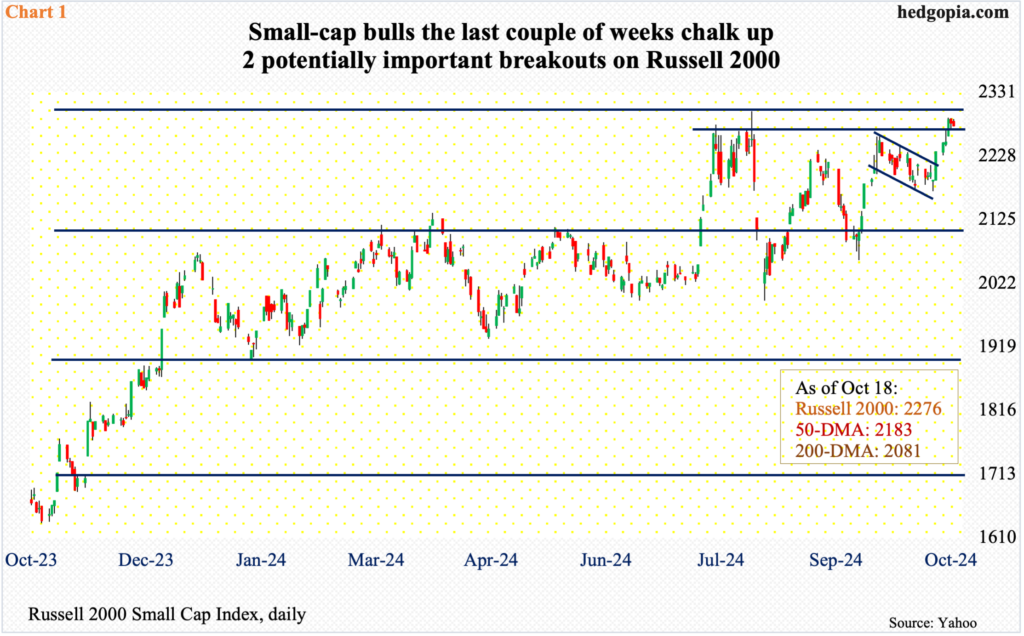
Small-caps have spring in their step. Having peaked as far back as November 2021, this is not the first time the Russell 2000 is trying to come to life, but all those attempts fizzled out in due course. Since reaching 2459 back then, the small cap index dropped all the way to 1641 by June 2022, which was successfully tested in October of both 2022 and 2023. The rally from last October climaxed on July 31 this year at 3000, before reversing hard lower (Chart 1). Small-cap bulls have a decent opportunity to go after that high in the sessions to come.
Two weeks ago, the Russell 2000 broke free of descending-channel resistance going back to September 18 when it ticked 2259. Horizontal resistance at 2260s goes back to mid-July. Last week saw a breakout at that price point, with the index rallying 1.9 percent for the week to 2276, with a high of 2289 on Wednesday.
A decisive takeout of 3000 can help build on the recent positive momentum.
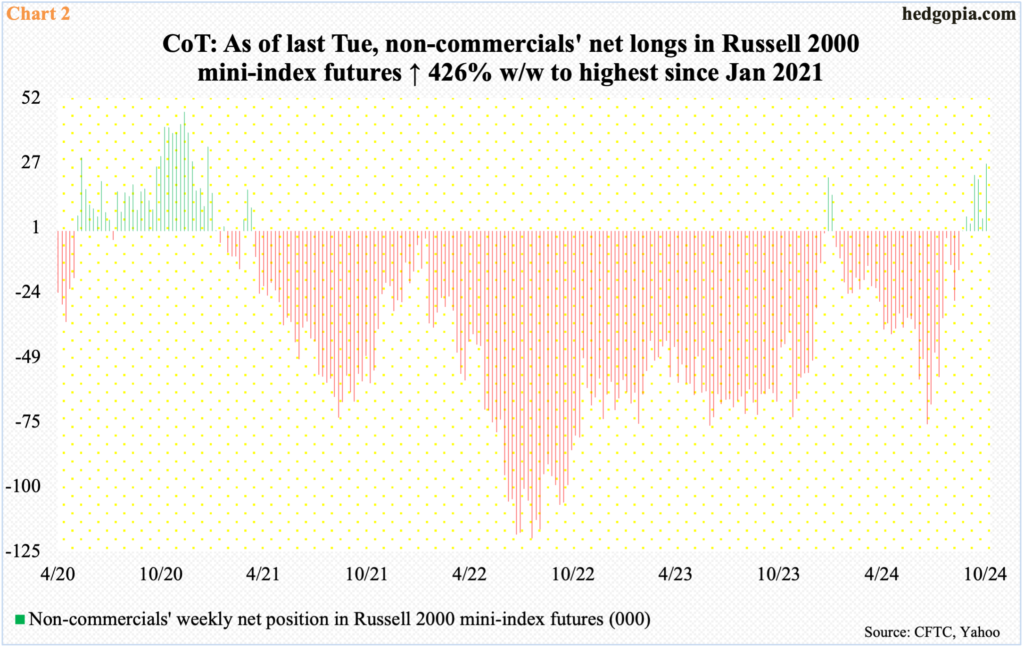
Judging by their positioning in futures, non-commercials are betting that better days await the Russell 2000.
As of last Tuesday, non-commercials were sitting on 26,337 net-long contracts in Russell 2000 mini-index futures. They have remained net long for seven weeks now. Earlier, barring a brief two weeks in January, these traders have consistently been net short since the early months of 2021. The latest holdings are the highest since January 2021 (Chart 2).
By nature, small-caps have a large exposure to the domestic economy – larger than their mid- to large-cap cousins, the latter in particular.
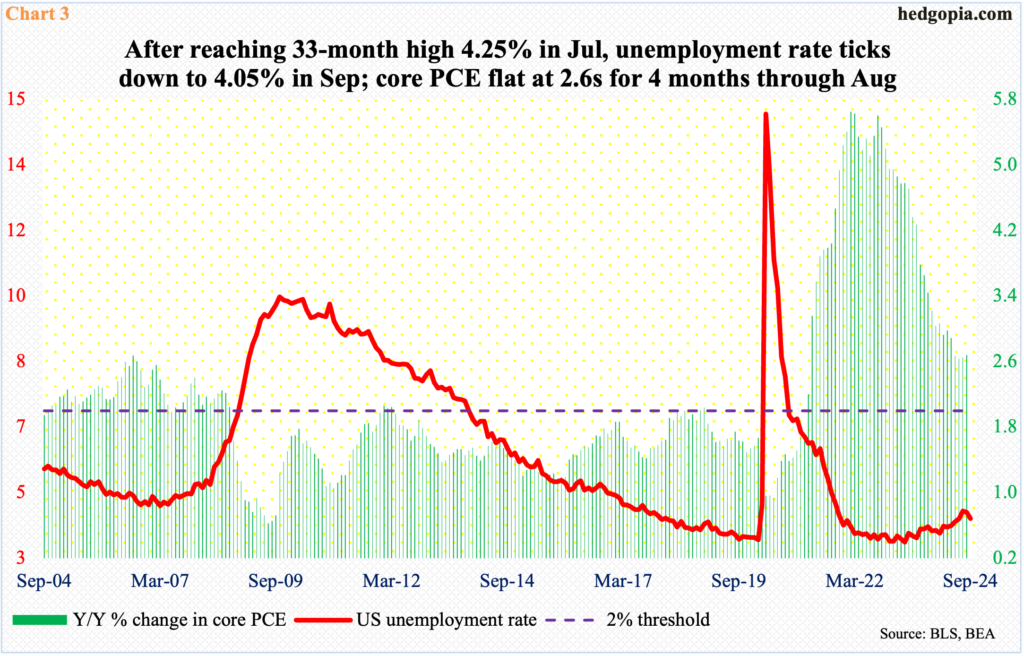
The economy continues to surprise on the upside. Manufacturing is on the weak side, but services continue to percolate. September saw an addition of 254,000 non-farm jobs, which was way better than expected, and the unemployment rate fell to 4.05 percent, matching June’s reading; earlier, it rose as high as 4.25 percent in July – a 33-month high (Chart 3).
In the meantime, core PCE, which is the Federal Reserve’s favorite measure of consumer inflation, has gone sideways at 2.6s for four consecutive months through August, when it increased 2.68 percent year-over-year. In February 2022, core PCE was growing at a four-decade high of 5.65 percent. It has come down quite a bit from that high but is proving stubborn above the central bank’s goal of two percent. (September’s numbers are due out on the 31st this month.)
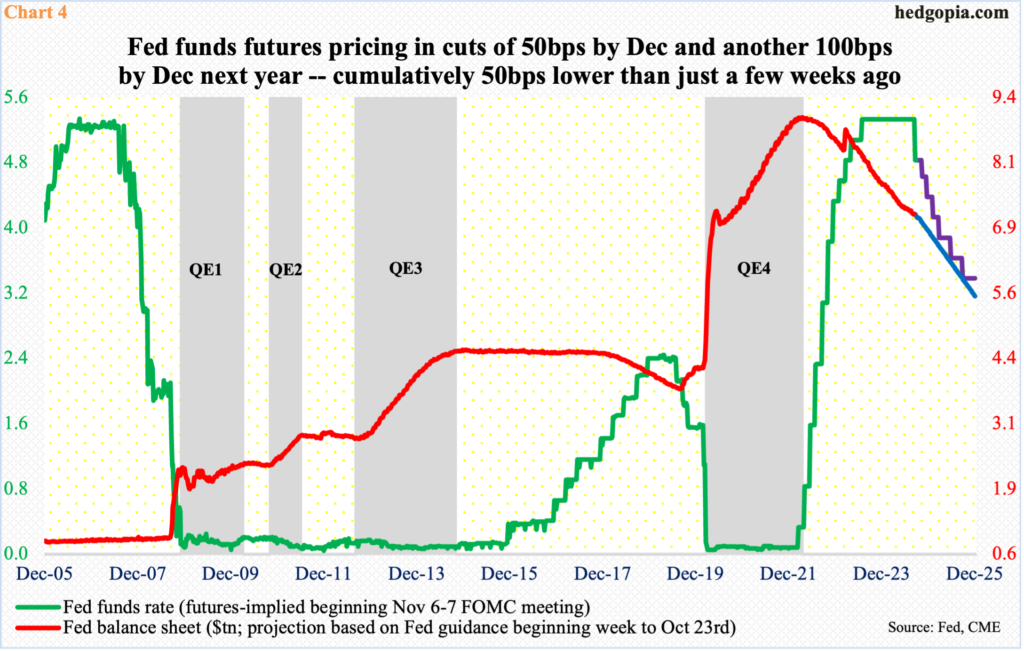
Strength in the most recent macro data thus has turned markets’ interest-rate outlook on its head. Until just a few weeks ago, particularly after the FOMC cut the fed funds rate by 50 basis points in September (17-18), futures traders were pricing in another 50 in November and a 25 in December, followed by 125 more basis points of cuts next year, ending 2025 at a range of 275 basis points to 300 basis points. Their enthusiasm has now cooled down – to expecting two more 25-basis-point cuts this year and another 100 next year (Chart 4). This is 50 basis points lower than what they were expecting just a few weeks ago.
It is entirely possible these traders may have to lower their expectations further for next year, given how resilient the economy has turned out to be.
Small-caps tend to be more interest-rate-sensitive than large-caps – not the least because the group consists of tons of community and regional banks. They are also more leveraged, with a higher percentage of floating-rate debt, than large-caps.
A Goldilocks economy where it is neither expanding nor contracting by too much can be friendly to small-caps, but not if either of the other two scenarios comes to pass.
If the economy does not land at all and continues on the current trajectory, the Fed will probably have second thoughts about continuing to stimulate by lowering the fed funds rate further; it can also continue to reduce its balance sheet (Chart 4).
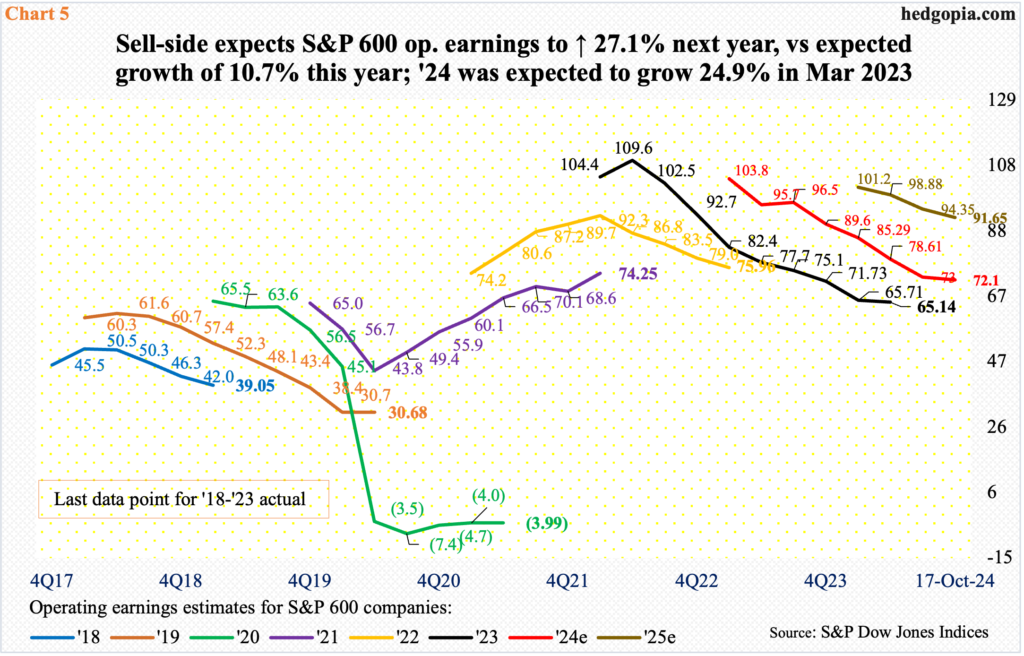
If on the other hand the economy sputters, rates will be lower but there will be repercussions elsewhere. As of last Thursday, S&P 600 companies were expected to bring home $72.10 in operating earnings this year, although the fact remains that the sell-side was expecting $105.68 in March last year (Chart 5). These analysts are notorious for starting out optimistic and then bring out the scissors as the year progresses. Along these lines, they have modeled in $91.65 for next year, for growth of 27.1 percent versus the expected growth of 10.7 percent this year. Next year’s estimates are already prone to downward revision – more so if economic growth begins to decelerate.
Small-cap stocks remain trapped in this push-and-pull, with the Russell 2000 meaningfully lower from its high from nearly three years ago. Amidst this, if the index manages to take out 3000 in a convincing manner and head higher, this can be viewed as markets’ way of saying things are finally resolving for the better.
Thanks for reading!

