
The 2Q earnings season has gotten off strong. Stocks, having already rallied big into it, yawned. This is coming at a time when sentiment remains effusive and some of the tailwinds potentially turning into headwinds. VIX’s monthly chart could be itching to rally.
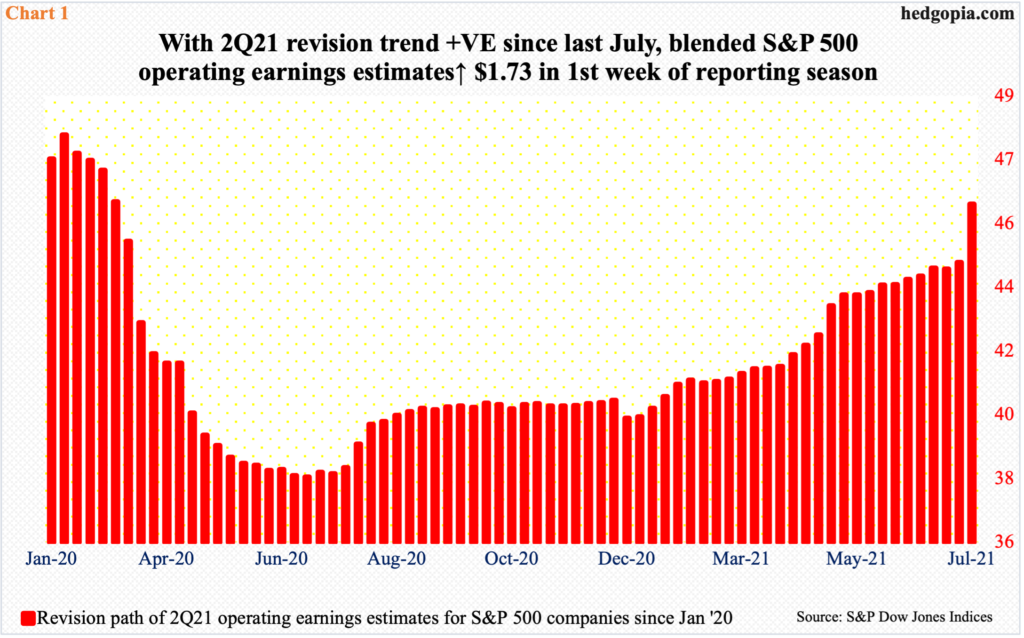
The 2Q earnings season has gotten off to a great start. Last week, major US banks and brokers reported. As of last Thursday, blended operating earnings estimates for S&P 500 companies increased $1.73 to $46.08 (Chart 1).
Similarly, blended 2Q estimates for S&P 400 companies went up $0.32 to $33.66 and for S&P 600 companies $0.19 to $16.11.
Staying with the large-caps, after a post-pandemic swoon, the revision trend bottomed in June last year. At the end of 1Q, meaning as 2Q began, the sell-side expected $41.24. They then revised their numbers throughout the quarter, ending at $44.15. In a show of conviction, they did not feel the need to lower their numbers just before companies began reporting, which is the case more often than not.
It is early in the season, but last week’s post-earnings reaction was dismal – to say the least. The S&P 500 dropped one percent, with Friday’s 0.8-percent decline accounting for a bulk of it. XLF (SPDR Financial Fund) declined 1.6 percent for the week.
Ahead of 2Q earnings, major US indices, including the S&P 500, had rallied strongly, with the large cap index jumping 8.2 percent. A ‘buy the rumor, sell the news’ could very well be in progress.
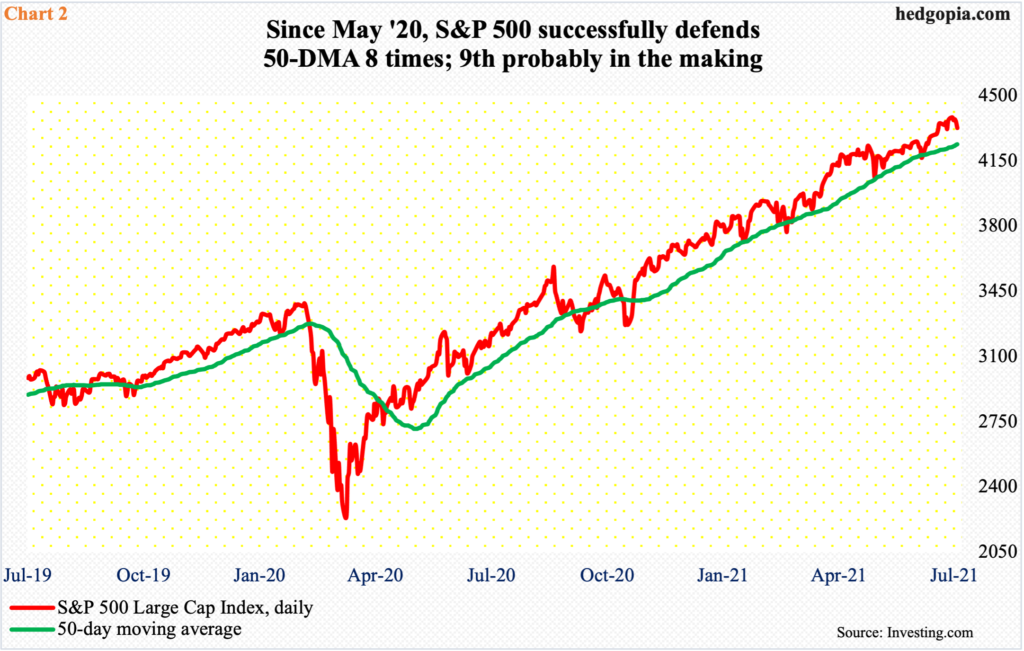
In Wednesday’s spinning top session, the S&P 500 ticked a new intraday high of 4394 but bulls were unable to hang on to the gains. On Friday, the index (4327) sliced through the 10-day moving average. A test of 4250s is looking probable in the sessions ahead.
The 50-day at 4239 lies a bit below, and a test will be important. Going back to May last year, the average has been tested eight times – all successfully, barring a few temporary breaches (Chart 2).
Midway through the month, July is still up 0.7 percent but has so far formed a potentially bearish shooting star.
Stocks’ inability last week to get a lift off of earnings has for the most part been blamed on inflation, which has perked up in recent months.
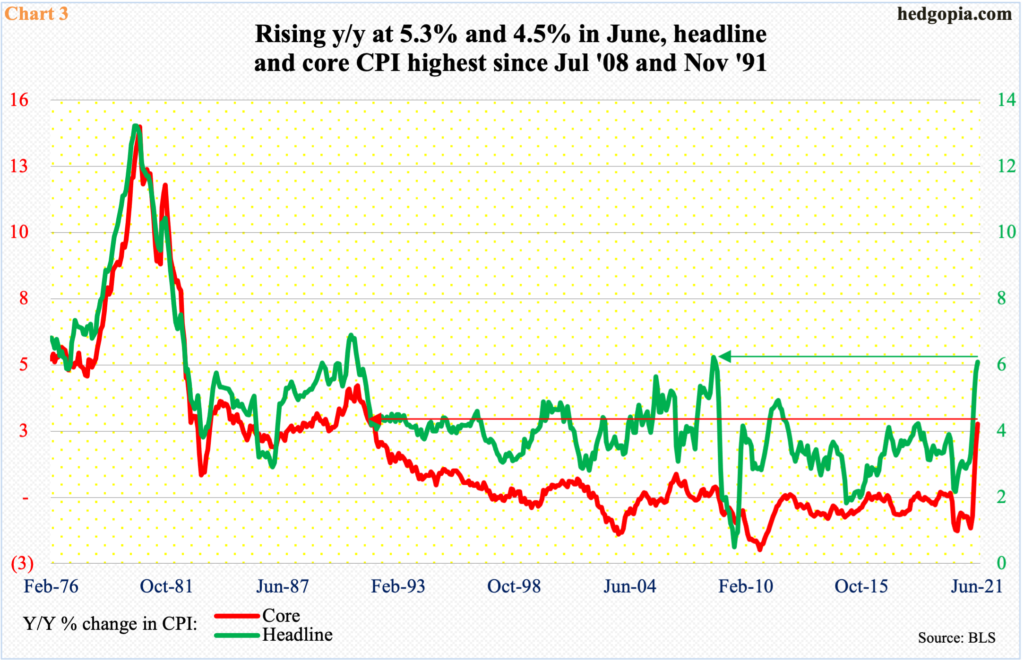
In February, headline and core CPI grew year-over-year at a rate of 1.7 percent and 1.3 percent respectively. By June, this had accelerated to 5.3 percent and 4.5 percent; this was the steepest price rise since July 2008 and November 1991, in that order (Chart 3).
But it is difficult to argue that the spike in consumer prices played a role in last week’s selloff in equities. By now, the majority, including the Fed, believes that this is temporary and will not last. The bond market concurs. Last week, the 10-year treasury yield shed six basis points to end the week at 1.3 percent, having broken crucial low-1.40s support early this month, followed by a failed backtest last Tuesday.
Flows are not quite cooperating. In the week to last Wednesday, SPY (SPDR S&P 500 ETF), VOO (Vanguard S&P 500 ETF) and IVV (iShares Core S&P 500 ETF) took in $915 million, a much slower pace than the combined $16.6 billion they attracted in the prior four (courtesy of ETF.com). At $628 million, flows were also mediocre into US-based equity funds in the week to Wednesday (courtesy of Lipper).
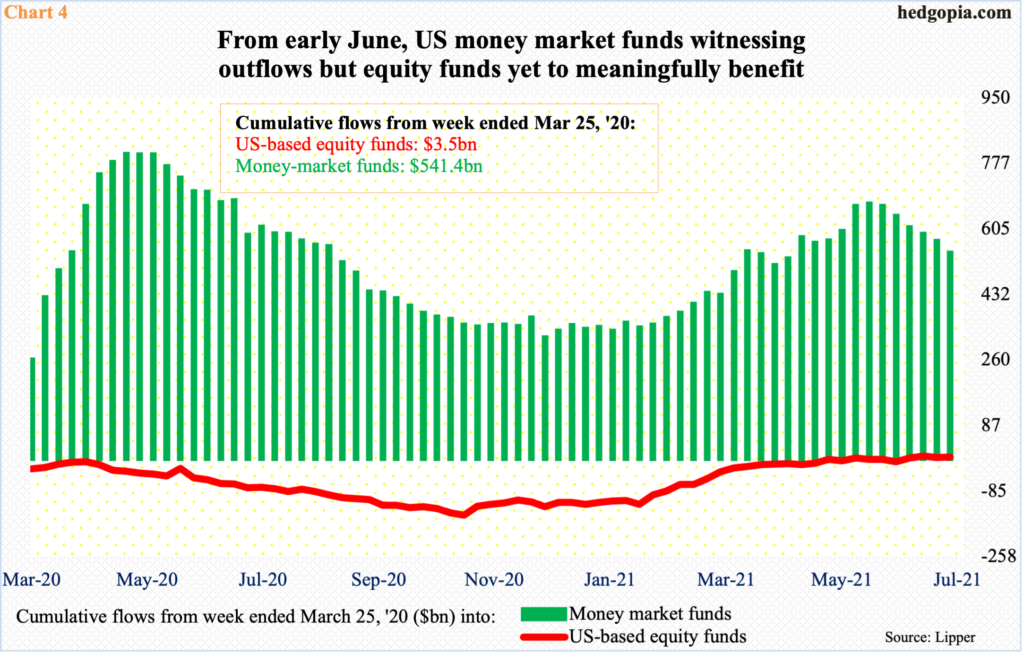
Major US equity indices reached a major low in March last year. Since then, the S&P 500 nearly doubled. But flows into US-based equity funds never took off. Cumulative flows from that date were negative until the last week of May, taking in merely $3.5 billion as of last Wednesday (Chart 4). All along, money market assets grew, peaking at $4.61 trillion in the week to June 2, before dropping to $4.48 trillion as of last Wednesday (courtesy of ICI). That is a drop of $132 billion, but not a whole lot moved into equities.
This is taking place at a time when seasonally stocks tend to struggle. Longs are sitting on tons of gains. If earnings-induced rally does not materialize, they have a good reason to want to at least lock some in.
Should things unfold this way, sentiment is so elevated it can unwind a good deal.
In the week to Wednesday, the NAAIM Exposure Index, which represents members’ average exposure to US equity markets, rose 10.7 points week-over-week to 93.3. Two months ago, this was 44.2. These are professional money managers and look to be all in – just about.
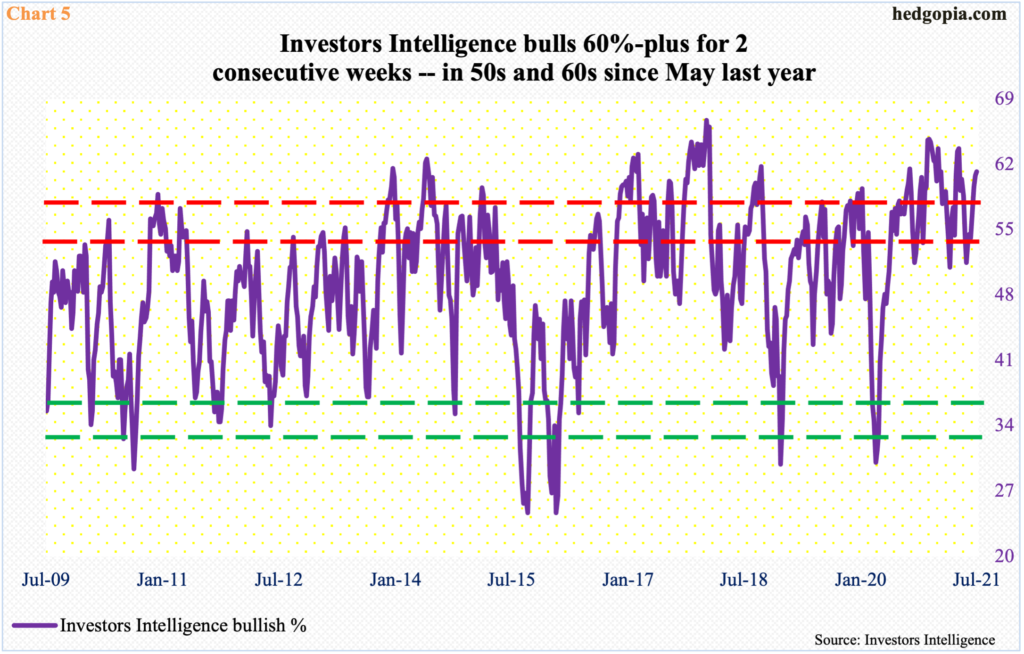
Sentiment is also lop-sidedly bullish among newsletter writers. In the week to last Tuesday, Investors Intelligence bulls inched up 0.4 percentage points w/w to 61.2 percent – for a back-to-back 60-plus reading. Readings north of 60 percent are rare (Chart 5).
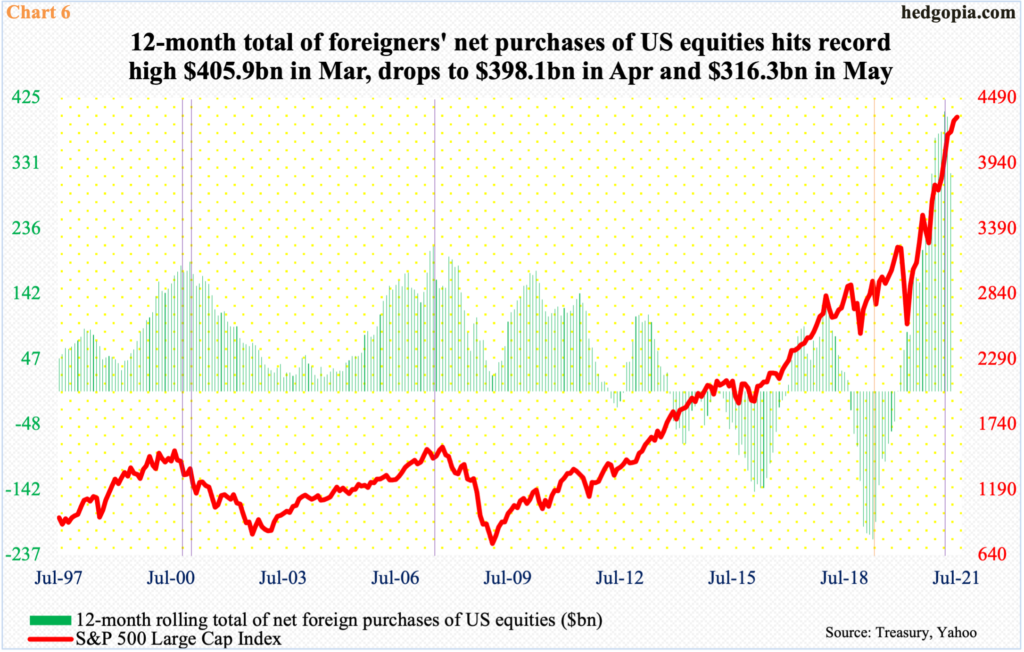
One of the pillars of strength in the ongoing bull market for equities has come from foreigners, who rode the uptrend very well. It is very possible they are beginning to cash out.
In April and May, they net sold $15.4 billion in US stocks. This comes on the heels of 11 consecutive months – or in 16 out of 17 – of net purchases.
As a result, the 12-month total peaked in March at $405.9 billion – a new record. This then decelerated to $398.1 billion in April and $316.3 billion in May (Chart 6).
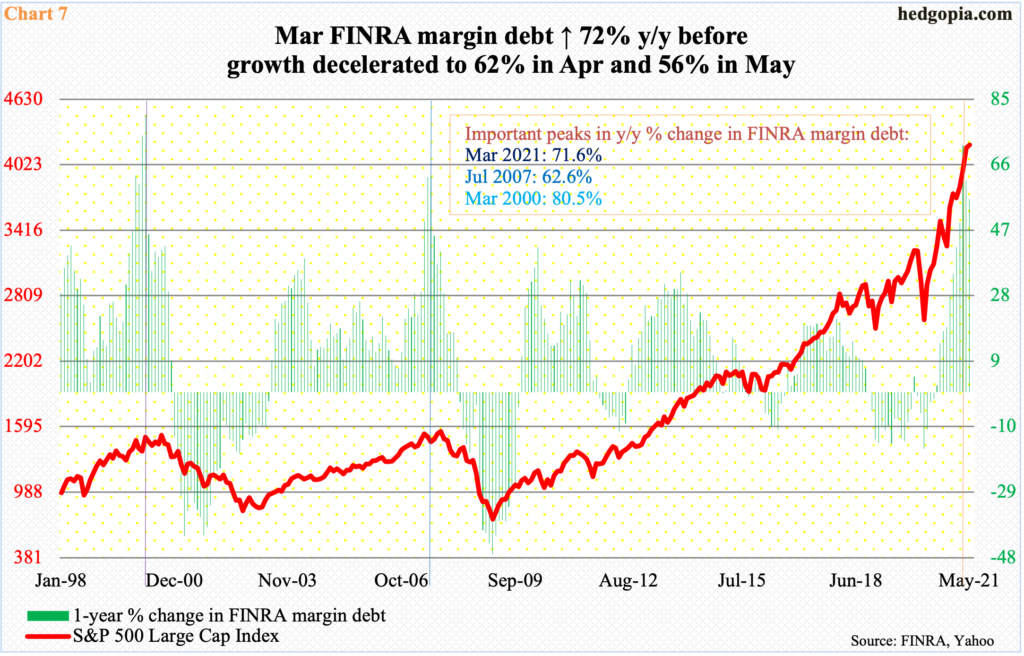
Another pillar of strength has been margin debt, which in May rose $14.4 billion month-over-month to $861.6 billion, which was a new high but even here things could be getting ready to slow down. June’s numbers could be out anytime now and will be revealing.
Margin debt has provided a massive tailwind for stocks. In March last year, it bottomed at $479.3 billion, for an 80 percent growth through May. Amidst this, the rate of y/y change peaked in March, followed by deceleration in both April and May (Chart 7). This is worth watching. It does not take long before a tailwind turns into a headwind.
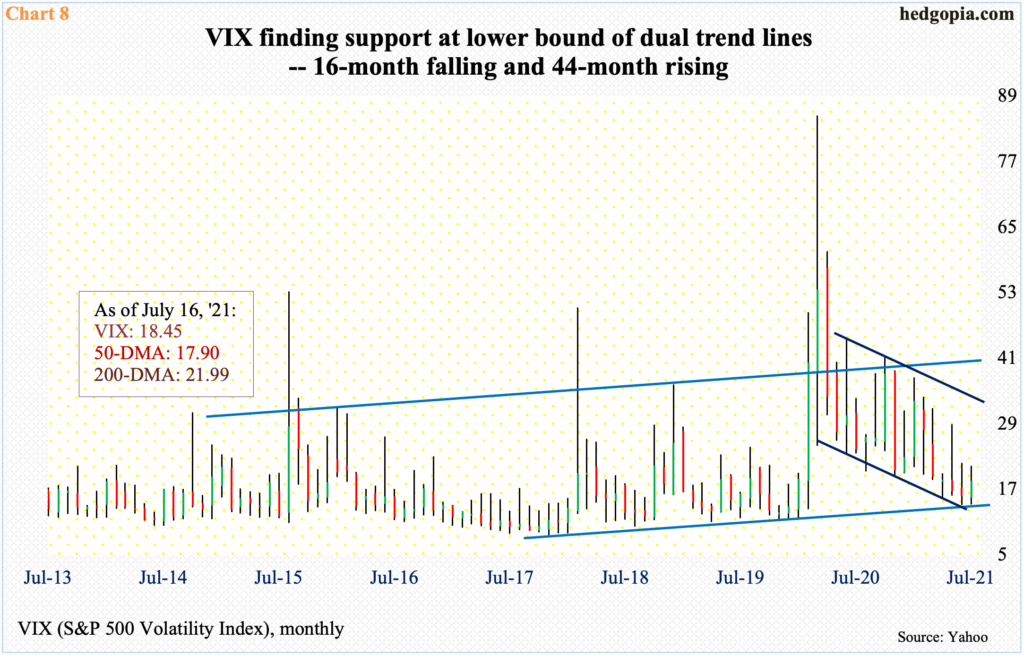
As stocks relentlessly rallied, volatility just cratered. In March last year, VIX surged as high as 85.47. The subsequent drop has seen a series of lower highs, with the most recent being 21.29 on the 8th this month. In late June and early this month, it dropped below 15.
Even amidst this downtrend, volatility bulls have managed to defend dual trend line support – a falling one going back 16 months and a rising going back 44 months (Chart 8).
The monthly could be getting ready to rally. Last week, except an intraday dip just below 16 on both Tuesday and Wednesday, VIX held firm, ending the week up 14 percent to 18.45. The 50-day is now flattish, likely getting ready to turn up.
There was straight-line resistance at 18, which was reclaimed last Friday. Volatility bulls can now think about going after low-20s. A takeout of the aforementioned 21.29 will establish a higher high. The 200-day is at 21.99.
All in all, a case can be made for a pick-up in volatility and a give back of part of the year’s gains in equities.
Thanks for reading!
