
The S&P 500 large cap index is testing the lows of February, but VIX acts nowhere near as panicky. This could be a tell for stocks near term.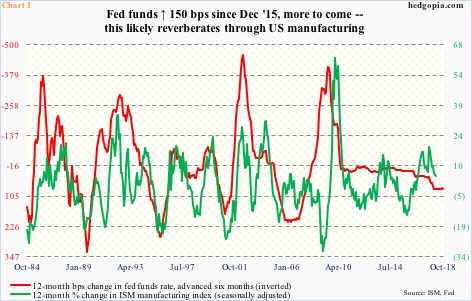
The ISM manufacturing index dropped 1.5 points month-over-month in March. February’s 60.8 was the highest since 61.4 in May 2004. Manufacturing is strong. It is difficult to imagine activity continuing at this pace.
This is particularly so considering that interest rates have trended higher.
After essentially putting the interest-rate pedal to the metal near zero for seven long years, the Fed raised the fed funds rate by 25 basis points in December 2015 to a range of 25 to 50 basis points. Since then, rates have gone up by another 125 basis points, to between 1.50 percent to 1.75 percent.
Historically, these are still very low rates, but a lot of times it is not only the level but also the rate of change that counts.
In Chart 1, the red line represents 12-month basis-point change in the fed funds rate, and, in keeping with the rise in rates, has begun to rise (or drop in the chart as the line is inverted.) The FOMC’s dot plot forecasts two more hikes this year, meaning the red line will continue higher. Historically, ISM manufacturing has had an inverse relationship with the red line with a lagging effect.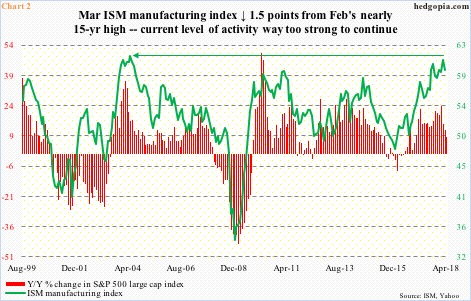
Viewed this way, that manufacturing softened in March should not come as a surprise. Activity is way elevated, and mean reversion only makes sense. More deceleration probably lies ahead. This will have repercussions for a whole host of things, not the least of which is stocks.
Perhaps anticipating this, the year-over-year change in the S&P 500 peaked in January this year, and has continued lower (Chart 2). If past is prologue, should the green line continue lower, it will have a bearing on the red bars.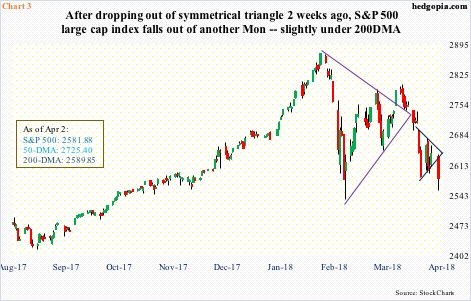
Hence the significance of how stocks are behaving. Major US equity indices act weak technically. The S&P 500’s – as well as others – monthly chart is relevant here. Momentum indicators have turned lower. In the right circumstances for the bears, as is the case with ISM manufacturing, these indicators can go a lot lower.
The drop Monday below the 200-day moving average is apropos.
The S&P 500 peaked on January 26 at 2872.87, followed by a reversal low of 2532.69 on February 9. Between those two points, it traded within a symmetrical triangle, which it fell out of two weeks ago (Chart 3). The February low defended the 200-day, and then again six sessions ago. Monday, the average gave way, although by only eight points.
Near term, it likely does not get much worse here. The daily chart is oversold, and a reprieve is the path of least resistance.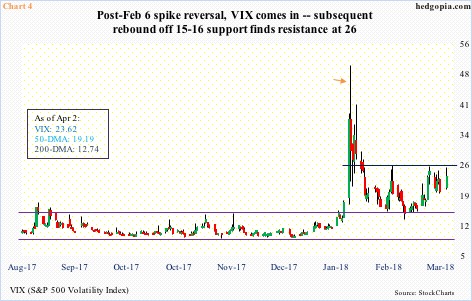
Perhaps tellingly, the amount of panic currently reflected in VIX is nowhere near what was seen when stocks were at their lows early February.
On February 6, VIX shot up intraday to 50.30 (arrow in Chart 4) before reversing. From volatility bulls’ perspective, barring a brief intraday drop below 14 early March, support at 15-16 held. That said, 26 has proven tough, even though the S&P 500 is testing the February lows.
This divergence in how VIX behaved back then and how it is behaving now can be a tell. We will see. Plus, the 1Q18 earnings season begins in earnest next week.
Put all this together, the odds of a bounce are decent – duration and magnitude notwithstanding. In a scenario in which the S&P 500 rallies, overhead resistance is galore. The 50-day, for instance, lies at 2725.40. How it acts at/near that average will tell a lot about whether or not the monthly chart will continue to unwind its overbought condition.
Thanks for reading.
