
February and March wrought technical damage on major US equity indices, but the path of least resistance increasingly looks up near term.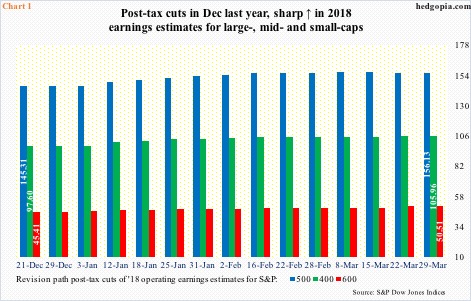
March-quarter earnings season is upon us. This is the first quarter US companies will be reporting after the Tax Cuts and Jobs Act of 2017 was signed into law on December 22 last year. Among other things, the federal corporate income tax rate was reduced from 35 percent to 21 percent.
The sell-side was quick to revise earnings estimates higher. Between December 21 last year and March 29, this year’s operating earnings estimates for S&P 500 companies went from $145.31 to $156.13, for S&P 400 from $97.60 to $105.96, and for S&P 600 from $45.41 to $50.51 (Chart 1).
In the most recent week, estimates for S&P 400 were at a new high, while for S&P 500 they peaked two weeks ago at $156.45 and for S&P 600 one week ago at $50.66.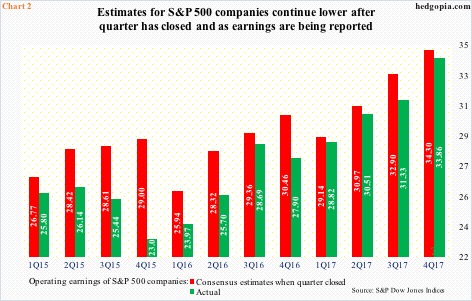
At least for S&P 500 companies, the 2018 revision trend seems to be plateauing. This is also evident in 1Q18 estimates, which ended the quarter at $35.64 after peaking at $35.81 three weeks ago. They have more or less gone sideways in the past couple of months.
If past is prologue, by the time the 1Q18 reporting season winds down, earnings would have come in less than what the sell-side was expecting at the end of the quarter, which, to reiterate, was $35.64. This has been a persistent theme going back several quarters. In 4Q17, for instance, the consensus was $34.30 at the end of December, versus actual earnings of $33.86 when it was all said and done (Chart 2).
Should the trend continue, this can potentially act as a tailwind for stocks in the form of a lower bar. At least the bulls hope so.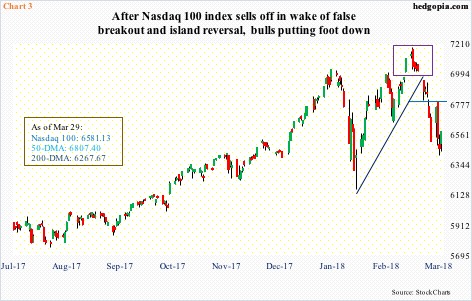
Major US equity indices have suffered technical damage. Tech was a leader going into the selloff that began in late January, and was also the most to lose in March, with the Nasdaq 100 index down four percent versus a loss of 2.7 percent for the S&P 500 large cap index and 3.7 percent for the Dow Industrials. The Russell 2000 small cap index, in fact, logged a 1.1-percent gain in the month.
After the reversal low on February 9, the Nasdaq 100 was also the only one among major indices to surpass the late-January high. As it turns out, the breakout was false. Plus, the daily chart traced out an island reversal pattern (box in Chart 3). On the monthly chart, January’s 8.5-percent surge was followed by a hanging man in February and another bearish-looking candle with a long wick in March.
Risk is building medium- to long-term. Near-term may be different. The bulls are putting their foot down. The daily chart is oversold. Immediately ahead, resistance lies at 6800, which is about where the 50-day lies. Similarly, bids showed up near the 200-day on the S&P 500.
In the right circumstances, help can come from Chart 4.
On a closing basis, the ratio of VIX to VXV closed last week at .972, having peaked at 1.09 in the prior week. This was a lower high versus eight weeks ago when it rose as high as 1.17. Accordingly, the recent low on the S&P 500 is higher versus the low on February 9 – both on an intraday and closing basis.
Since the intraday spike reversal high of 50.30 on February 6, VIX has come under pressure, as protection sought near term began to unwind. At the same time, except for one intraday dip below 14 early March, support at 15-16 held. With VIX at 19.97, even if this support holds, there is room for it to head lower.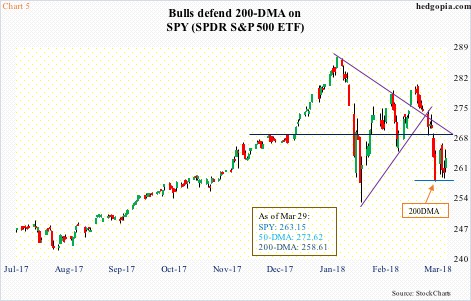
Concurrently, the S&P 500, or SPY (SPDR S&P 500 ETF), can rally. Once again, the index/ETF has suffered technical damage. The 50-day – now pointing down – has been lost. Between the all-time high of $286.63 on January 26 and the reversal low of $252.92 on February 9, the ETF ($263.15) traded within a symmetrical triangle, which it fell out of two weeks ago.
From the bulls’ perspective, the good thing is that the 200-day has been defended (Chart 5). Near-term, odds are rising for at least a test of broken-support-turned-resistance at just under $269.
In this scenario, weekly options can at least help earn some premium – similar to the opportunity on February 12.
Hypothetically, SPY April 6 261 puts are going for $2.16. A naked short put is risky but in this instance if assigned it is a long at $258.84, pretty close to the 200-day.
Thanks for reading!
