
- NYSE short interest rises to match mid-Oct highs, diverges from Nasdaq
- Within Nasdaq, shorts aggressive in pure tech, but less so in biotech
- Relatively low short interest on IBB probably does not help longs
It is getting a little difficult to make heads or tails of what is going on in the short interest arena.
On the NYSE composite, it has risen to nearly match the mid-October level when stocks bottomed. Back then, short interest rose from 14.1 billion at the end of May (2014) to 15.8 billion. Then stocks rallied. Shorts got squeezed. By December-end, they cut back by over five percent. The past five weeks, they have been adding again. By the middle of the month, short interest stood at 15.7 billion (Chart 1).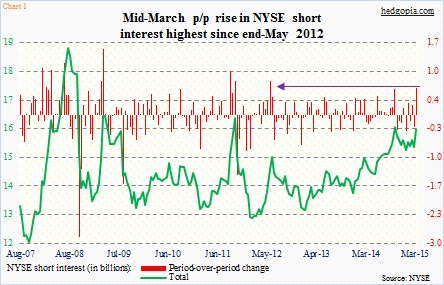
Off mid-October lows, the NYSE is up 10 percent. So what does this mean to have flattish short interest? (1) That shorts are getting more convinced of their bearish thesis? (2) That they may end up getting squeezed again? And (3) that there could be other factors at play for the flattish reading?
Scenario (1) is very plausible given the deteriorating earnings picture and the persistent deterioration in macro data points (except for payroll data). Unless fundamentals do a U-turn for the better, there is not much risk of (2), at least in the near-term. Particularly so after yesterday’s session, in which an awful durable-goods report was treated as such and not as a pretext to stay long thinking this means the Fed stays dovish.
Indeed, the Nasdaq composite does offer a slightly different picture. As a reminder, the NYSE does not only trade corporate stocks, but other securities as well.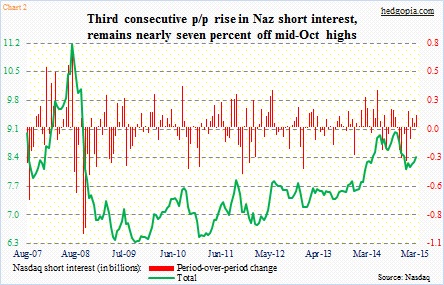
The green line on the right side of Chart 2 looks substantially different from one in Chart 1. Short interest on the Nasdaq is nearly seven percent off mid-October highs. Of course, Naz shorts have had their pain, too, as they were forced to reduce from 9 billion in the middle of October to 8.1 billion by December-end. The past several weeks, they have also been adding, though with much less aggression.
Which begs the question, is the NYSE data influenced by other securities? The latest period-over-period increase was the highest since May 2012.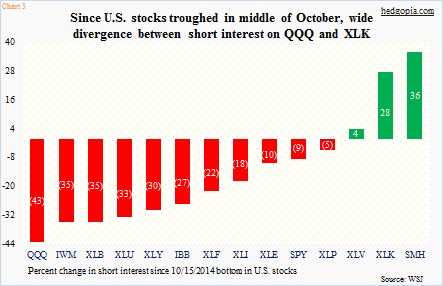
Looking at Chart 3, it is looking probable.
The chart calculates the percentage change in short interest for various sectors, and sub-sectors, since mid-October. Most of them are down, some substantially. This more reflects short interest dynamics on the Naz than on the NYSE.
And within the Naz, there is tech versus biotech. QQQ is down 43 percent. XLK is up 36 percent. What gives? The former has biotech, the latter is pure tech. In QQQ, the top ten stocks comprise 46.5 percent, two of which are biotech – GILD three percent and AMGN 2.5 percent. This is not that big of a weight to make an outsize impact on the ETF, nonetheless versus XLK, which has no biotech exposure, it matters.
Shorts have been burned the past several months trying to short IBB, and they are not jumping back in. The ETF’s short interest has come down from 11.1 million in the middle of September to eight million now.
Strange as it may sound, this has the potential to hurt IBB longs, at least in the near-term. A high level of short interest can help stabilize things during a decline as shorts get tempted to lock in gains. No such thing here. Short interest on IBB is already low, which also means there is room for new shorts to press their case.
Incidentally, it is the exact opposite with SMH. Short interest on the ETF is at a multi-month high. While shorts nailed the rout yesterday (and there is probably more to come), at some point their relatively large ranks should help stop the bleeding.
