
An options trade may be brewing on IWM, the iShares Russell 2000 ETF.
In the July 15-31 period, shorts’ bearish bet on IWM paid off. Short interest went up nearly five percent during the period. The ETF fell 2.1 percent, having in fact dropped nearly five percent at one time. In a larger scheme of things, IWM’s short interest is substantially below the mid-October 2014 level, which resulted in a massive short squeeze, but remains higher than what it was in the middle of February (Chart 1).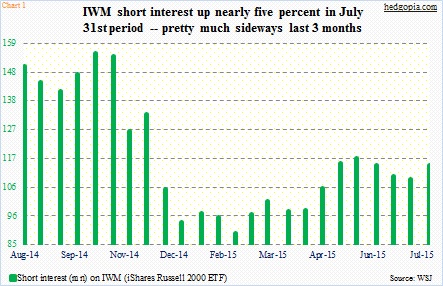
Similarly, in the past couple of weeks through August 4th, non-commercials’ net shorts in Russell 2000 futures went up by nearly 24,000 contracts, to a nine-week high (Chart 2). August 11th holdings will be out later today, but since July 21st IWM has lost 3.6 percent. Once again, bearish bets have paid off.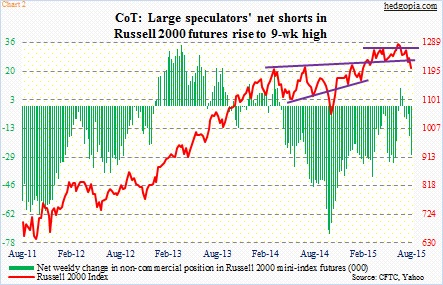
With that said, in the past several sessions, buying interest is beginning to show up on IWM. Wednesday’s action in particular smacks of a squeeze. Not that short interest is that high, but in the right circumstances there is room for more, however small.
During the most recent sell-off, buyers stepped up to the plate where they were supposed to. Since the peak on June 24 through the Wednesday low, the ETF lost just north of eight percent, substantially underperforming other major U.S. indices.
The good thing is, the 118-119 level has been defended. However, it must be pointed out that the Russell 2000 (1204.74) breached its equivalent support at 1210ish on Wednesday, albeit only slightly.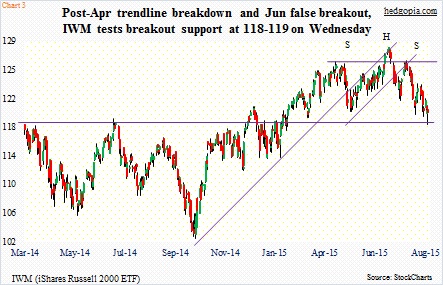
The 118-119 support on IWM ($119.62) goes back to March last year, and has not been tested since the ETF broke out six months ago (Chart 3). On a daily chart, conditions are grossly oversold, and should get there soon on a weekly basis.
Long-term, the signal is far from all-clear. IWM currently trades below both its 50- and 200-day moving averages. The distance between the two is rapidly narrowing – currently at a little over three points. Monthly momentum indicators have decidedly moved lower. In late April, the ETF broke the mid-October 2014 trend line, followed by a false breakout toward the middle of June. During all this back-and-forth action, a head-and-shoulders pattern has developed; the neckline corresponds to that 118-119 support.
Hence the significance of Wednesday’s test.
With that said, it is perhaps premature to get aggressively long the ETF, but a strategy geared toward earning income probably does not hurt in the near-term.
Weekly August 21st 119 puts fetch $0.92. Hypothetically, if exercised, a short put ensures going long at $118.08 – right on support. There are six sessions remaining, and odds are IWM may just consolidate under its 200 DMA at worst or rally at best.
Thanks for reading!
