
The S&P 500 is unable to decisively build on post-FOMC breakout. Amidst this, plenty of optimism is already built into options, and VIX acts like it wants higher prints.
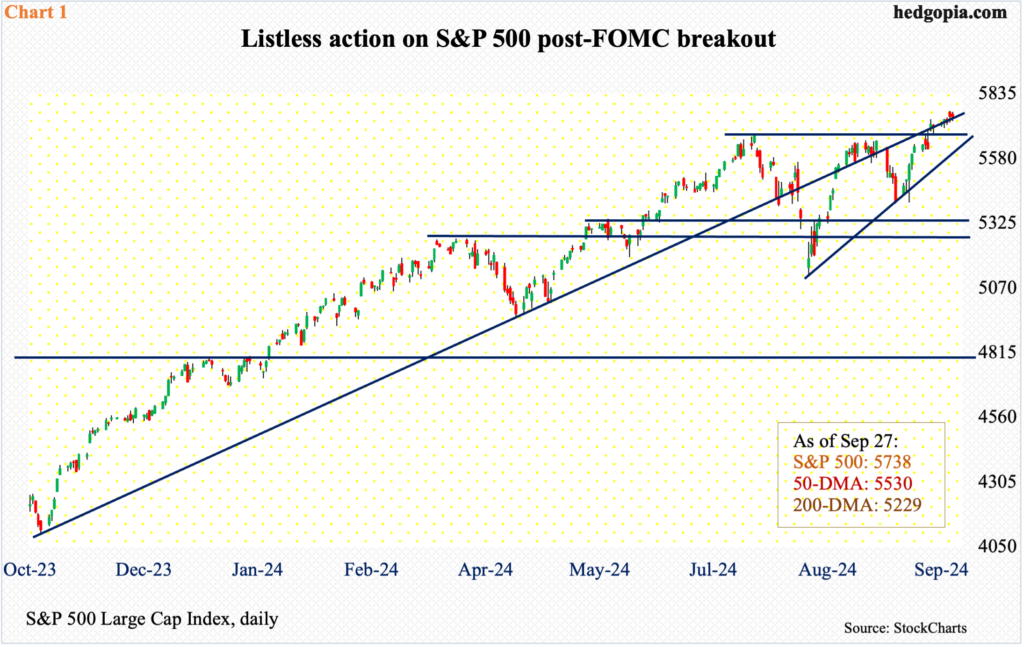
On the 19th, the day after the September 17-18 FOMC meeting, the S&P 500 broke out of 5670s, which represented the prior two highs – 5670 on July 16 and 5671 on September 17. This was immediately followed by Friday’s successful breakout retest. Equity bulls nevertheless are struggling to build on this positive development.
The large cap index is higher from that breakout, with last week’s 0.6-percent rally closing the index at 5738 and ticking 5767 on Thursday, but it continues to straddle a rising trendline from last October’s low (Chart 1). The trendline was breached twice since that low – early August and early September. Another breach seems to be in the works.
The daily is itching to go lower. Bears have an easy shot at 5670s, which is where a rising trendline from the August 5th low lies as well. It is a make-or-break for the bulls. A loss of this dual support opens the door to at least the 50-day moving average (5530).
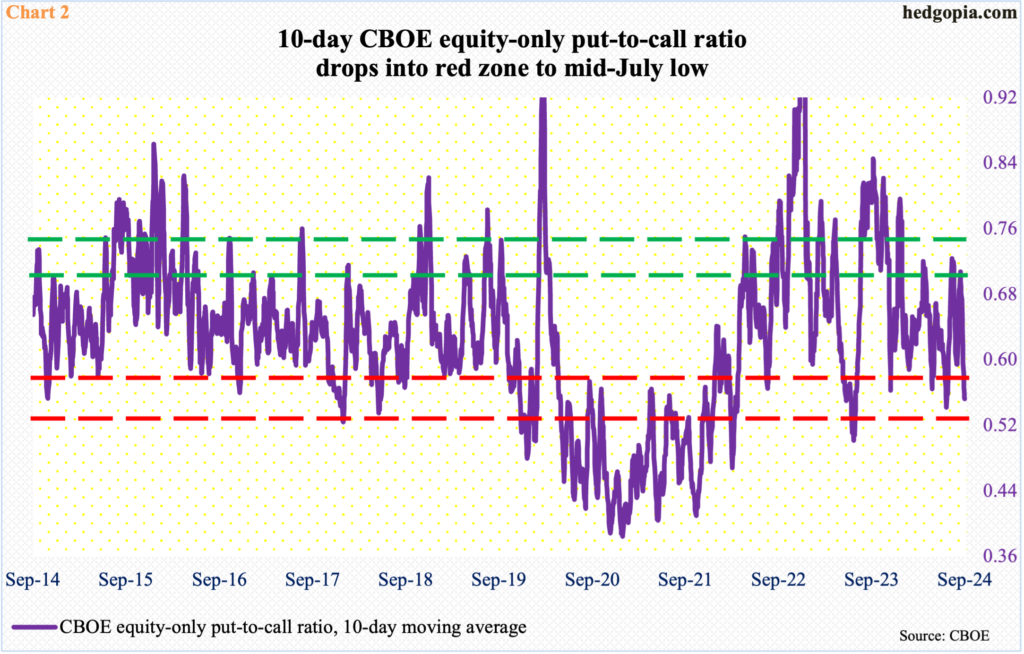
This is taking place at a time when plenty of optimism is already built into options. The CBOE equity-only put-to-call ratio ended last week with Friday’s 0.529 reading, which was the sixth session in a row of readings in the 0.50s or lower – and 11th in 13 – with a reading of 0.491 on the 23rd.
The 10-day average of the ratio last week stood at 0.553, which was the lowest since July 18 (Chart 2). Between July 16 and August 5, the S&P 500 dropped 9.7 percent.
There is a similar message coming out of the volatility land.
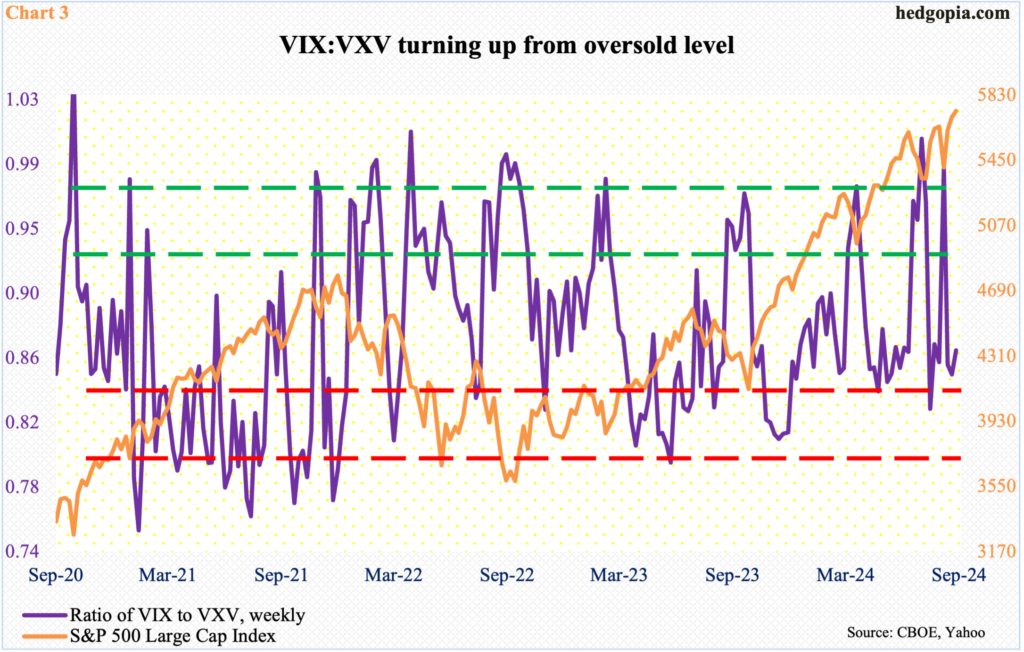
VIX measures market’s expectation of 30-day volatility on the S&P 500. VXV does the same, except it goes out to three months. When the investing climate is risk-on, as has been the case of late, demand for VIX-derived securities is lower than, let us say, VXV. The opposite is true when investor sentiment wanes.
Last week, the ratio of VIX to VXV closed at 0.87, up from 0.85 in the prior week. The ratio is turning up just short of dropping into the red zone (Chart 3). Unwinding of the oversold level will translate into VIX outperforming VXV, thereby putting the S&P 500 under pressure.
Speaking of which both VIX and the S&P 500 rallied last week – which is rare – with the former adding 0.81 points to 16.96 and defending the 200-day. VIX has closed above the average since July 17.
With a weekly bullish hammer last week, VIX could be ready to firm up. The weekly RSI is turning up at the median, which the metric has not breached for nearly three months.
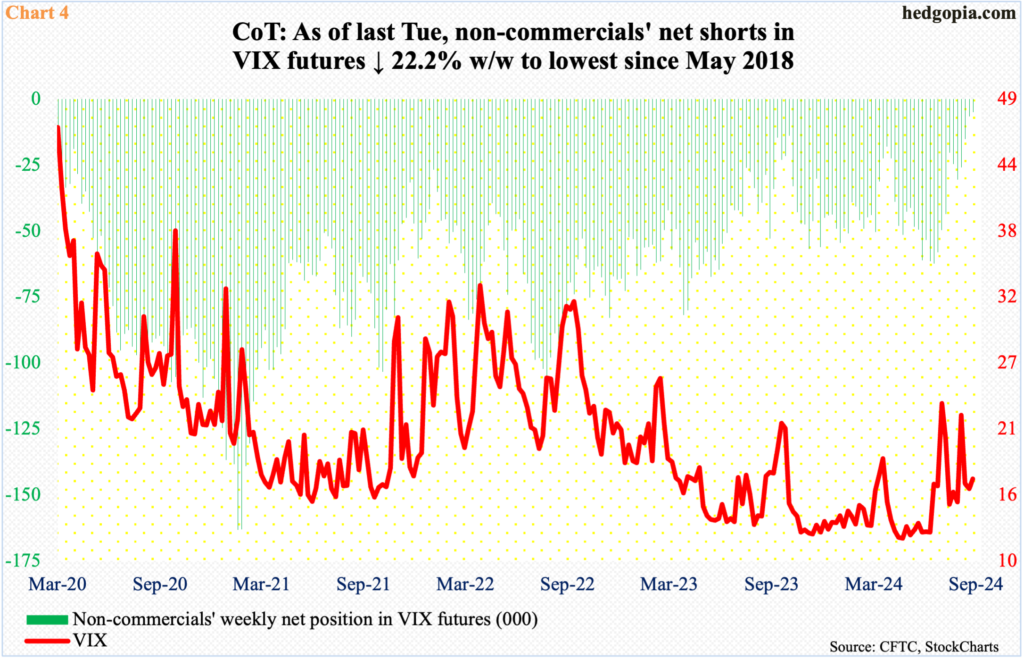
If VIX does indeed rally in the sessions/weeks ahead, it will be interesting to watch how non-commercials react. If past is prelude, VIX tends to peak as they either go long or get close to doing that.
As of last Tuesday, these traders were net short 5,067 contracts, which is the lowest since May 2018 (Chart 4). The last time they were net long was January 2019, when they remained net long for 11 weeks; in October-December 2018, the S&P 500 tumbled just north of 20 percent.
Friday brings September’s payrolls, and trader reaction will be a big tell.
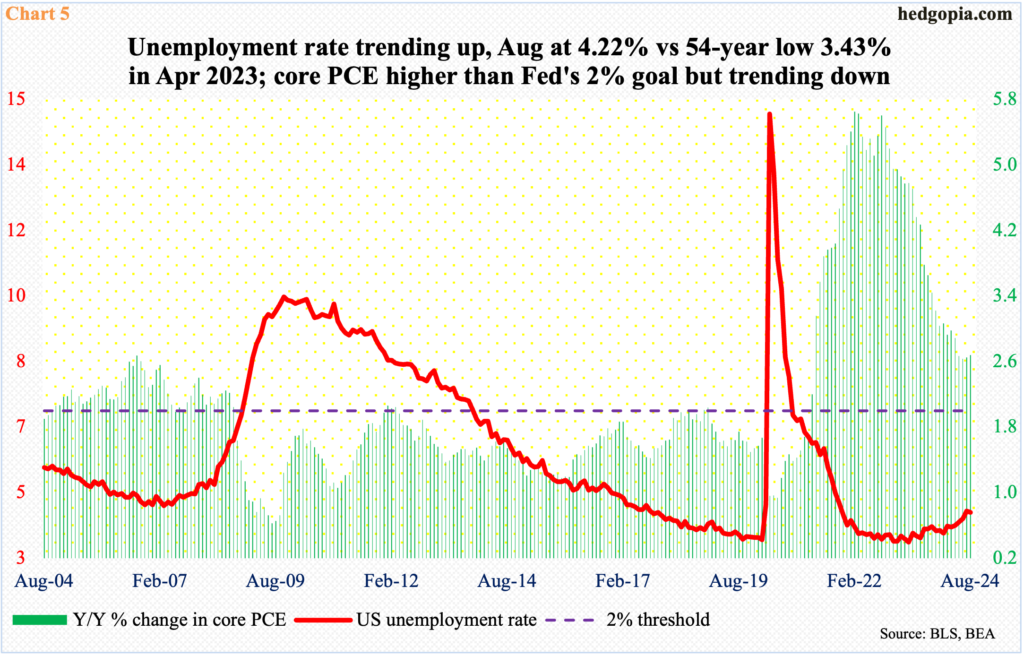
August’s PCE (personal consumption expenditures), which is the Federal Reserve’s favorite, was reported last Friday. Headline and core PCE rose 2.24 percent and 2.68 percent, in that order. In June and February 2022, they were growing at four-decade highs of 7.25 percent and 5.65 percent respectively. Core PCE has been flattish at 2.6s for four months now, with June’s 2.63 percent at a 40-month low; the headline was at a 42-week low in August. The S&P 500, having posted one after another record high, Friday tried but failed to rally on this inflation report.
The Fed has a dual mandate of maximum employment and price stability. It is now clear that they are focused on jobs, not inflation. In recent months, the unemployment rate has been rising, albeit slightly, with August at 4.2 percent (Chart 5). Markets are currently priced in for a goldilocks economy, in which inflation continues to behave, the economy continues to grow at a decent clip and the Fed continues to cut rates. The thing to watch out for is if stocks fail to respond to a supposedly favorable report necessitating continued aggression by the Fed in cutting rates.
Thanks for reading!
