
Small-caps broke out last week. This comes amidst earnings deceleration and softening in several macro data. If things turn up as they did in early 2016, bulls would have been vindicated. Their conviction level will be put to test by whether or not they are willing to aggressively buy when breakout retest takes place.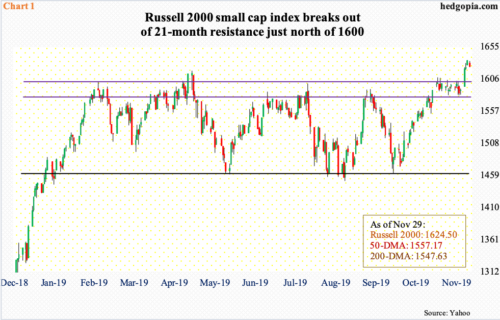
The Russell 2000 small cap index broke out last week.
Resistance just north of 1600 had been in place since January last year. This year, after the index bottomed late last year, the rally got stopped at that ceiling in February. Since then, four more breakout attempts were denied – until last week (Chart 1).
The latest rally began early October when small-cap bulls defended horizontal support at 1450s. If last week’s action is genuine, range-breakout traders could be eyeing to test the all-time high from August last year when the index (1624.50) peaked at 1742.09.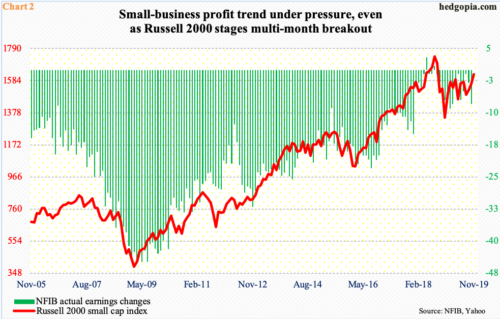
Last week’s action came in the midst of small-business profit trend that deteriorated further in October.
The NFIB (National Federation of Independent Business) sub index of ‘actual earnings changes’ worsened to minus eight in October from September’s minus three (Chart 2). In May of last year, it posted an all-time high of three, before retreating. Since that peak, it fell to minus nine in February this year, which is about where October ended.
The Russell 2000 obviously has gone the other way. Historically, the two tend to move in tandem. Bulls hope stocks are leading profits. At least going by the earnings revision trend particularly for next year, it is getting hard to completely buy into this scenario.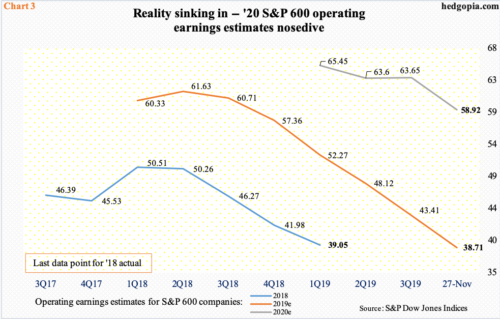
Until recently, 2020 operating earnings estimates for S&P 600 companies were holding up. As of October 17, the sell-side expected $66.86, before going sideways for several weeks. Then the bottom fell out. As of Wednesday last week, $58.92 was expected (Chart 3).
Notwithstanding the sharp downward revision, if 2020 estimates come through, earnings would have still massively grown from this year’s expected $38.71. Incidentally, in June last year, 2019 estimates were as high as $61.63. It has been nothing but downhill since. Things evolved similarly last year. With this as a background, it is likely the most recent downward push in next year’s estimates is not a one-time phenomenon. Rather, reality is sinking in.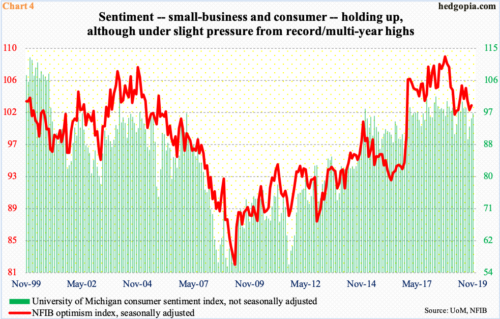
The deterioration in both the current profit trend and the outlook for next year is taking place even as small-business optimism continues to remain elevated. In October, the overall index rose six-tenths of a point month-over-month to 102.4. This was the 35th consecutive monthly reading of over 100. Incidentally, the metric peaked in August last year, as did the Russell 2000. Consumer sentiment similarly is under slight pressure but holding up near its highs (Chart 4).
In November, the University of Michigan’s consumer sentiment index rose 1.3 points m/m to 96.8. Except for August’s 89.8, sentiment has remained north of 90 since November 2016, four of which were 100 or higher.
Historically, both these sentiment measures more or less follow each other. Here is the problem. Consumers have been opening up their wallets. On the other hand, the expected improvement in the top and bottom lines of small businesses has not quite materialized, as is evident in the profit trend – both current and future.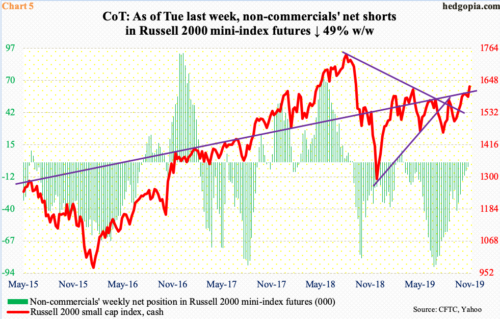
Hence the potential significance of last week’s breakout in the Russell 2000. More tea leaves are due out later this afternoon for markets to read.
Non-commercials are still net short Russell 2000 mini-index futures but have been reducing their short book for a while. Mid-July, they were net short 88,737 contracts. The week before, this came down to 3,793 contracts. Last week’s data (as of Tuesday) was delayed due to Thanksgiving holiday. Instead of last Friday, it will be published this afternoon. The cash broke out last Monday. So, today’s numbers will have captured investor sentiment of the first two sessions last week. It will be telling.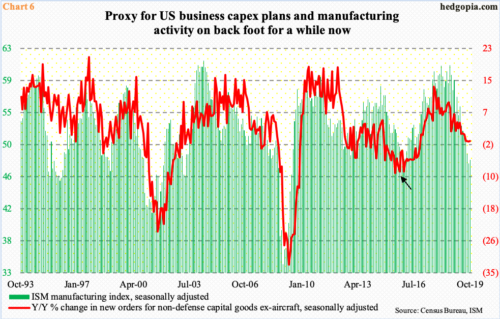
Here is how bulls would like things to evolve.
In late 2015-early 2016, the US economy seriously decelerated. Real GDP in 4Q15 only grew 0.1 percent. Between October 2015 and February 2016, the ISM manufacturing index remained sub-50 for five straight months. For 25 months ending November 2016, orders for non-defense capital goods ex-aircraft – proxy for business capex plans – contracted year-over-year (arrow in Chart 6).
There is a similar deceleration in progress currently. Manufacturing activity has remained sub-50 for three months in a row. (November’s data comes out this morning.) Through October, orders for capital goods ex-aircraft fell y/y for four months in a row. Bulls hope things are beginning to stabilize – a la what transpired in the early months of 2016.
In this scenario, small-cap stocks are trying to look ahead. If macro stability sustains, then the current downward revision trend in earnings hopefully begins to look up (Chart 3), and non-commercials continue to cut back net shorts and eventually go net long (Chart 5). In a scenario in which investors begin to price all this in, breakout retest on the Russell 2000 likely gets aggressively bought (Chart 1). Failure to hold the retest will have sent a different signal, raising possibility of last week’s breakout being a noise than a signal.
Thanks for reading!
