
With bulls latching on to every positive fundamental data, small-caps continue to build on breakout from three weeks ago.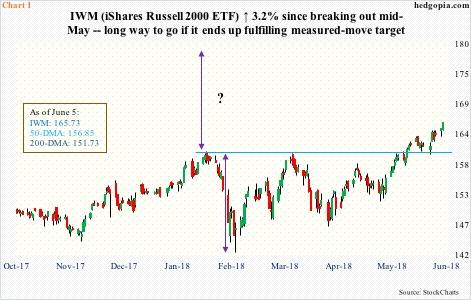
From the perspective of how they are acting and how they have outperformed their large-cap peers, small-caps are winning big.
After the February 9 low, of major US equity indices, the Russell 2000 small cap index was the first to rally to a new high and then successfully build on it.
Mid-May, IWM (iShares Russell 2000 ETF) took out its prior high from late January, followed by breakout retest. It already rallied 3.2 percent from that point. If the bulls had their way, they would love to see a measured-move pattern complete, which would mean another 7.9 percent in due course (Chart1). Thus far, they carry the momentum. Both 50- and 200-day moving averages are rising. Ditto with shorter-term averages.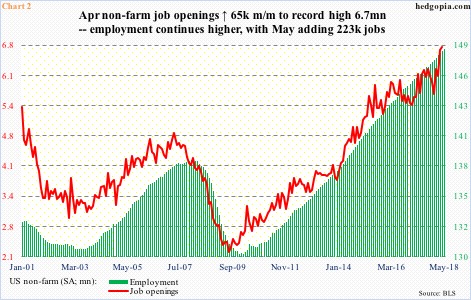
In order to build technical momentum, they are latching on to every positive fundamental data they could lay their hands on. Tuesday, IWM rallied 0.6 percent. May’s ISM non-manufacturing index rose 1.8 points month-over-month to 58.6, not too far away from January’s record 59.9 (data only goes back to January 2008).
More importantly perhaps was the number of job openings in the economy. In April, non-farm openings rose 65,000 to 6.7 million, a new record. They are yet to peak. There is not much history to go back on, but if past is prologue, openings tend to lead employment. The latter continues to chug along, adding 203,000 non-farm jobs in May (Chart 2).
May’s NFIB (National Federation of Independent Business) job openings are due out next Tuesday. April was 35, which since July 2017 has been hit three other times. A record high 36 was recorded in November 2000. If this metric is anything to go by, the small-business jobs outlook remains healthy. This is probably one reason why the bulls are not paying much attention to earnings revision trend that of late has shifted downward.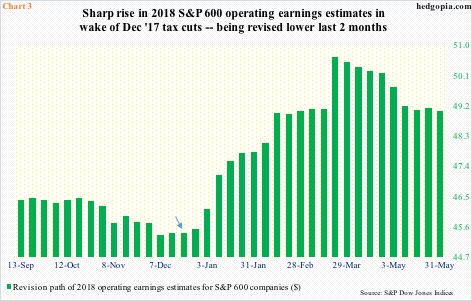
On December 21 last year, S&P 600 companies were expected to earn $45.41 this year (arrow in Chart 3). A day later, the Tax Cuts and Jobs Act of 2017 was signed into law. Then began the upward revision. By March 22, the sell-side had penciled in $50.66, and that was the peak. On May 31, estimates were $49.04. This is still phenomenal considering that 2017 earned $31.19.
With that said, when it comes to earnings, revision trend counts. From this respect, 2019 is on a similar downward trajectory. Estimates for next year were $60.94 on February 22, versus $59.28 on May 31.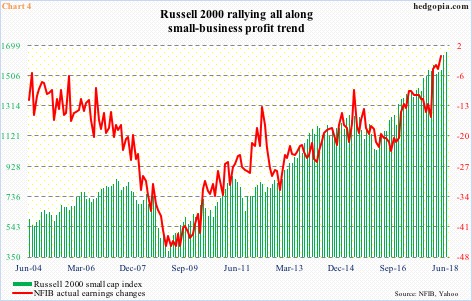
Rather than focus on the revision trend, small-cap bulls have their eyes set on the current profit trend. In April, the NFIB ‘actual earnings changes’ sub-index reached an all-time high (going back to January 1986). In the first four months this year, the metric improved 14 points. The Russell 2000 is closely in tow (Chart 4).
Time will tell if this strategy ends up working for the bulls not just near term but also medium- to long-term. The technically oriented ones would like to see completion of the aforementioned measured-move target. But even if this pattern were to fulfill, it is not going to get there in a straight line. Particularly because the daily chart is extremely extended. A pause followed by another successful breakout retest only strengthens the bullish case. If things were to evolve this way in the next several sessions, nimble shorts can take advantage. But near-term momentum has to break first. It is yet to do so, thus worth watching.
Thanks for reading!
