
Amid continued signs of macro deceleration, next year’s estimates for small-caps continue higher. The Russell 2000 index, however, is not quite buying this optimism. Last week, it led its large-cap peers, but remains under crucial resistance. Should small-caps come under pressure near term, it will be telling if they continue to lead their large-cap brethren.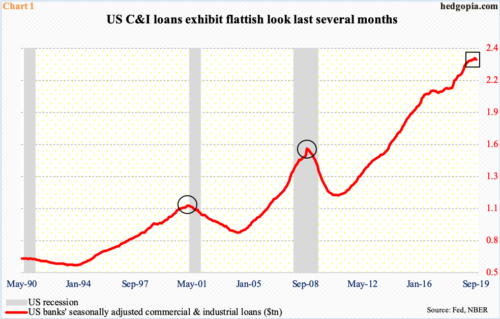
More and more macro data are pointing to ongoing deceleration in the US economy.
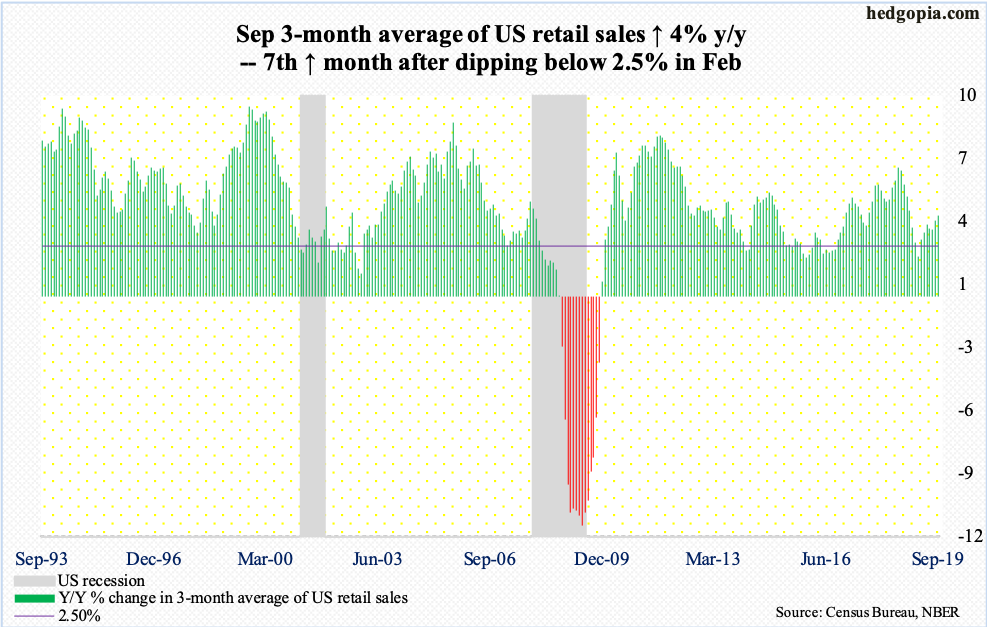
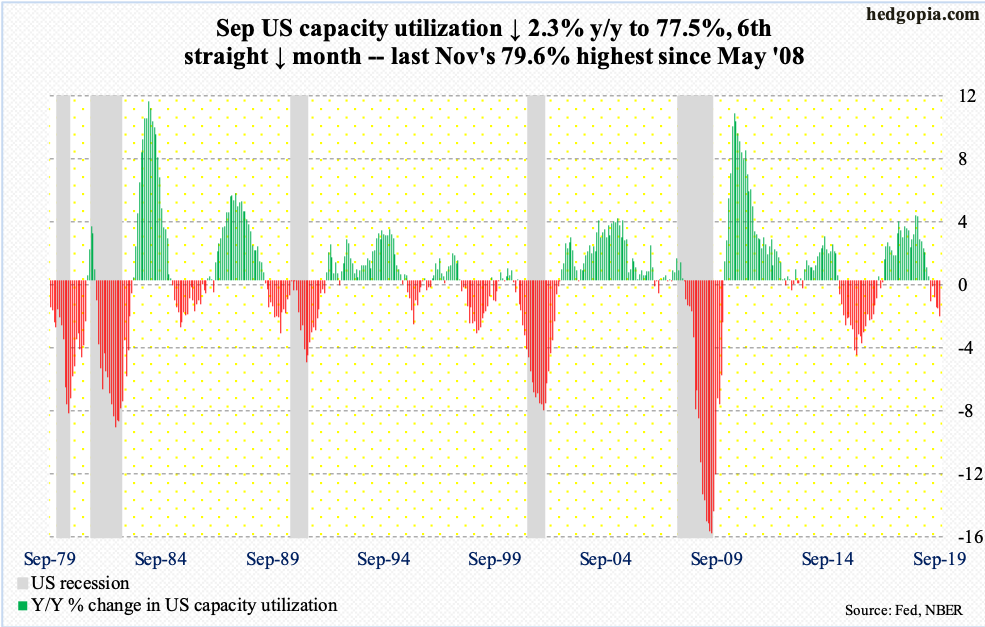
Retail sales in September fell 0.25 percent month-over-month to a seasonally adjusted annual rate of $525.6 billion, which was the first down month in seven. In the same month, capacity utilization dropped 2.3 percent year-over-year to 77.5 percent; this was the sixth straight down month, with the cycle high 79.6 percent recorded last November.
Also in September, banks’ commercial & industrial loans dropped $10.4 billion m/m to $2.35 trillion (SAAR). August’s $2.36 trillion was an all-time high, with a flattish look particularly the last four months (Chart 1). September’s is the first m/m drop in 22 months.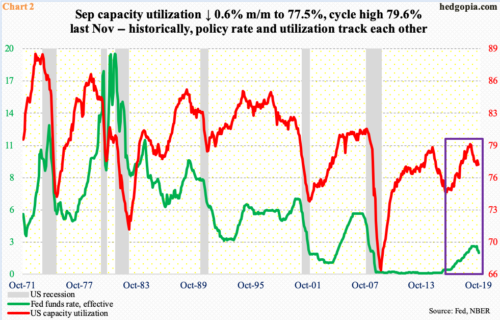
Later this month (29-30), the FOMC meets. Last Friday, futures were betting with 91-percent certainty that a 25-basis-point cut was coming. This is as good as a done deal. With this, by Wednesday next week, the fed funds rate would have gone down by 75 basis points this year to a range of 150 to 175 basis points. This is keeping up with the decline in capacity utilization (Chart 2).
Medium- to long-term, the problem is that rates are already so low the Fed’s monetary quiver lacks sufficient arrows. Post-financial crisis, major central banks are increasingly behaving as if they can do away with business cycles. In this environment, if things continue to deteriorate, the Fed has no other way than to launch another iteration of quantitative easing (QE). Markets are salivating over the prospect of this. During QE 1/2/3, stocks did very well.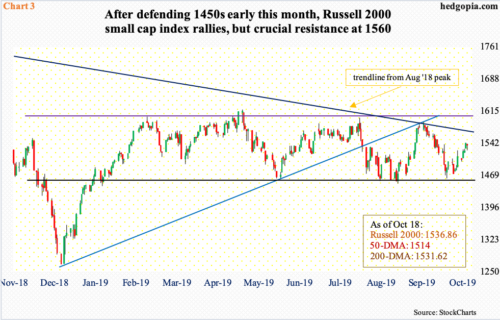
Despite the deteriorating macro backdrop, major US equity indices are just a stone’s throw away from their highs, even though small-caps severely lag their large-cap brethren. The Russell 2000 small cap index peaked in August last year at 1742.09 and closed last week at 1536.86. In contrast, the S&P 500 large cap index peaked this July at 3027.98 and closed last week at 2986.20.
Last week, small-caps performed better, with the Russell 2000 rallying 1.7 percent versus the S&P 500’s 0.5 percent rise and the Nasdaq 100’s 0.3 percent. Thursday, small-cap bulls reclaimed the 200-day moving average (1531.62) and the 50-day (1514) on Tuesday. But the index remains below crucial resistance just north of 1600. As things stand, they have to clear another roadblock at 1560, which represents trend-line resistance from August last year, before 1600 can be attacked (Chart 3). The daily is getting overbought. Immediately ahead, bulls face the challenge of saving the 200-day, which was already tested Friday.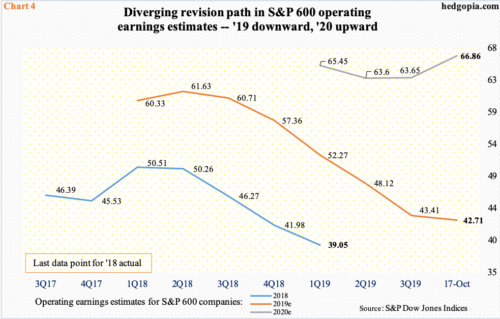
Increasingly it feels like an increasing number of investors are not buying next year’s projected path of earnings for S&P 600 companies.
As of last Thursday, the sell-side penciled in $42.71 for this year and $66.86 for next. The revision path for 2020 is decidedly up (Chart 4). In February this year, these analysts expected $67.63, which by July had come down to $60.80, before beginning to upwardly revise their numbers. The problem behind this optimism is that it not only diverges from the revision trend for both S&P 500 (large cap) and 400 (mid cap) companies but also with how 2019 is unfolding.
In June last year, S&P 600 companies were expected to earn $61.63, which turned out to be way too optimistic from what is being expected now. Last year evolved similarly. This is probably making investors cautious about taking 2020 estimates at face value.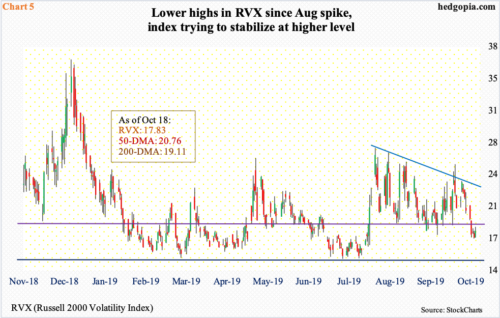
RVX (17.83) is holding up – relatively, of course.
In the weeks leading up to the August 2018 peak in small-caps, the Russell 2000 volatility index routinely dropped to 10-11. Between March and July this year, this shifted upward to 14-15 (Chart 5). In the past month, 17 has provided support.
The daily likely is in the process of forming a base. Both the 50- and 200-day lie above (20.76 and 19.11, in that order). Importantly, since hitting 26.89 early August, RVX has made lower highs. This gets broken around 22.50.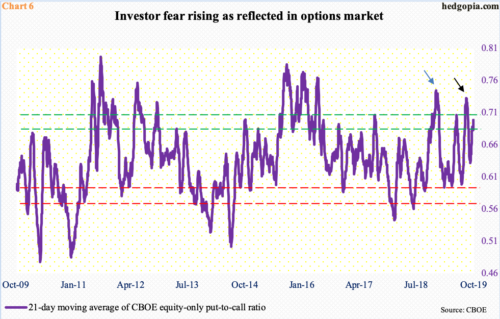
If volatility gets a lift near term, this likely also gets reflected in the CBOE equity-only put-to-call ratio. The 21-day moving average ended last Friday at 0.699, which rose from 0.632 on September 24. As the ratio rose, the S&P 500 came under pressure. Historically, the ratio tends to peak at high 0.60s to low 0.70s. If stocks come under pressure near term, the ratio has room to rally further. On August 23, it retreated from 0.733 (black arrow in Chart 6) and from 0.744 on December 24 last year (blue). This laid the foundation for the rally in stocks that followed.
In this scenario, as stocks come under pressure near term, it will be a tell if small-caps continue to lead large-caps, as was the case last week. Risk-on sentiment led by small-caps will be welcomed by markets.
Thanks for reading!
