
It has been a while since U.S. small-caps reached a new high (arrow in Chart 1). The Russell 2000 small cap index (1209.74) peaked in June last year at 1296.
Small-caps have massively underperformed large-caps.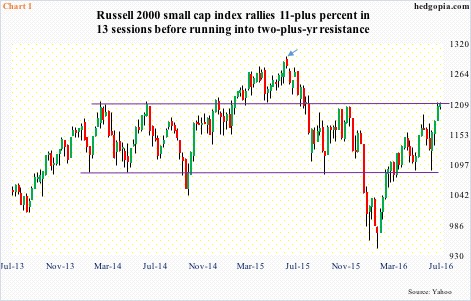
Both the S&P 500 large cap index and Dow industrials have broken out to new highs. Both these indices had been going sideways since February last year. Hence the recent breakouts can prove to be important. Its significance would be doubly enhanced if small-caps joined them or were even leading. Or, techs and transports, for that matter. Both the Nasdaq composite and the Dow transportation average are still below their respective all-time highs.
The Russell 2000 in particular has been going sideways since March 2014 (Chart 1). This is longer than the consolidation experienced by the S&P 500. A breakout hence would be significant even if this would not mean a new high. The index is north of seven percent from the all-time high of June last year.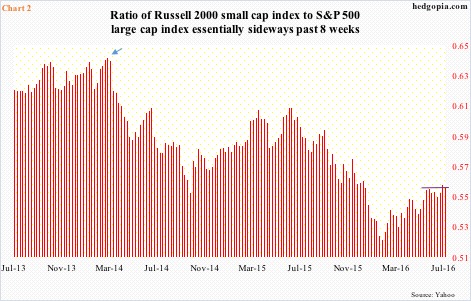
Importantly, since March 2014, the Russell 2000 has been steadily underperforming the S&P 500 (arrow in Chart 2). Even when the Russell 2000 rallied to a new high in June last year, underperformance versus the S&P 500 continued. Both highs and lows are progressively lower. Most recently, the ratio began to rally from the February lows, but has essentially been going sideways in the past eight weeks (Chart 2).
From a macro perspective, small-caps lagging their larger-cap brethren probably speaks volumes about the state of the economy. Unlike the latter that can have sizable overseas exposure, the former by nature rely on the domestic economy. 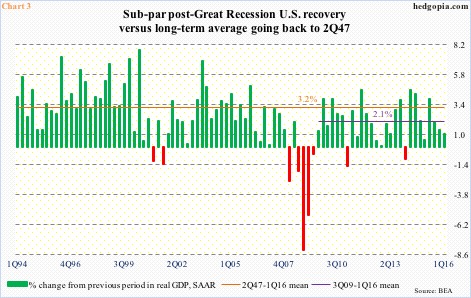
In this respect, post-Great Recession recovery has been sub-par, with real GDP averaging 2.1 percent growth since 3Q09. This compares with 3.2-percent growth going all the way back to 2Q47 (Chart 3).
Along the same lines, orders for non-defense capital goods ex-aircraft – proxy for business capex – dropped 3.8 percent y/y in May to a seasonally adjusted annual rate of $62.3 billion. This was the 7th consecutive y/y drop, and 16th in the last 17 months. Orders peaked in September 2014 at $70.7 billion.
To refresh, the Russell 2000 began to go sideways in March 2014. Also, corporate profits adjusted for inventory and depreciation peaked in 3Q14 as well. Profits were $2.16 trillion back then, and by 1Q16 had dropped to $1.9 trillion.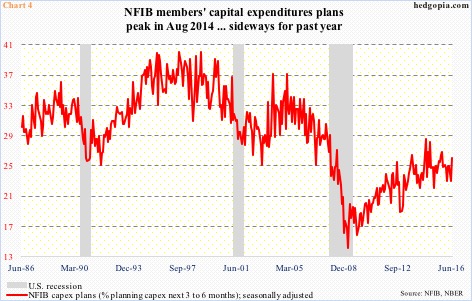
Viewed this way, is it any coincidence then that National Federation of Independent Business members’ capex plans peaked in August 2014 (Chart 4)? That high matched the high of December 2007.
Long story short, U.S. economic activity is subdued, and if this is what the Russell 2000 is reflecting, then a breakout, should it come to pass, will not be easy to sustain.
Once again, this resistance has been in place for over two years now, hence a breakout potentially can take out a ton of stops.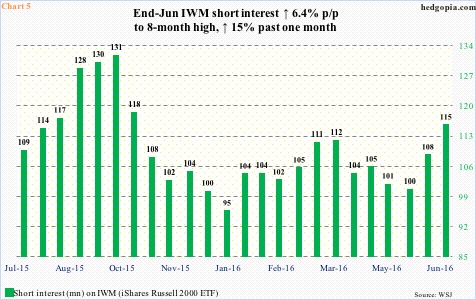
Plus, short interest on IWM, the iShares Russell 2000 ETF, is rather high (Chart 5). By the end of June, short interest rose 6.4 percent period-over-period to 115.1 million – an eight-month high. Short interest has gone up 15 percent in the past month. In the right circumstances, this is potential fuel for squeeze.
Since June 30th through the intra-day high yesterday, the Russell 2000 rallied north of five percent. This probably caused some level of squeeze already. A breakout has the potential to squeeze more shorts. But once this tailwind is over, then what?
Year-to-date, the Russell 2000 is up 6.5 percent, IWM has only attracted $838 million. Small-caps have ceased to generate excitement. Reason why the index is struggling to break out in the first place.
Thanks for reading!
