
After massive rallies since the lows of March, major US stock indices saw sellers show up later last week at/near important resistance. Some indicators made a quick switch from fear to greed. This is coming at a time when the Fed’s balance sheet is still growing but the pace has softened. Unwinding of overbought conditions is the path of least resistance.
Reality is starting to sink in.
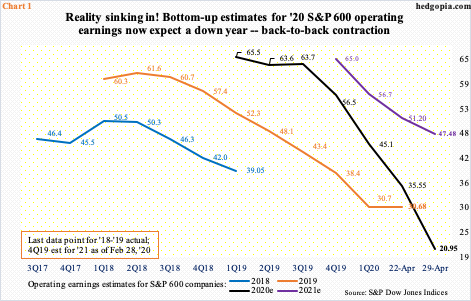
The sell-side now expects 2020 operating earnings for S&P 600 companies to drop from last year – finally. Until April 22nd, these analysts expected $35.55 this year, versus $30.68 in 2019. A week later, that is as of 29th, this year’s bottom-up estimates collapsed to $20.95 (Chart 1). This would now represent a 31.7-percent contraction from last year – a back-to-back decline. In 2018, earnings were $39.05.
Directionally, this year’s estimates for small-cap earnings are now in line with mid- and large-caps. The sell-side already expected operating earnings for S&P 500 and 400 to drop this year, which as of April 29th stood at contraction of 20.1 percent and 25.6 percent, in that order.
As far as 2021 is concerned, the sell-side, once again, is back to its usual optimistic self. Earnings are expected to snap back strongly, with growth of 32.9 percent to $166.81 for S&P 500 companies, 47.8 percent to $104.39 for S&P 400 and 126.6 percent to $47.48 for S&P 600. We do know this. The revision trajectory is decidedly down. As of February this year, 2021 estimates for S&P 600 companies were as high as $64.96. It is too soon to say if they are done going down.
Corporate earnings obviously will have a lot to do with how the US – in fact, global – economy fares, and on that score, the coronavirus pandemic is a wildcard. The only certainty is uncertainty. April’s ISM report in this regard provides a window into what might lie ahead in a worse-case scenario.
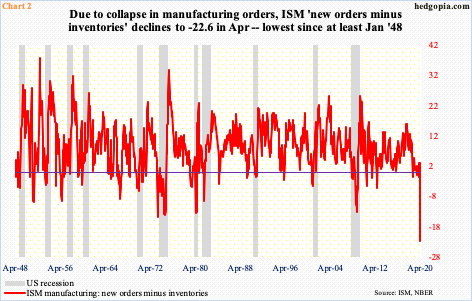
Last month, US manufacturing activity contracted 7.6 points month-over-month to 41.5 – second straight sub-50 reading and seventh out of last nine. The April reading was an 11-year low. Orders fared even worse, collapsing 15.1 points m/m in April to 27.1, which was the lowest since December 2008. Inventories, in the meantime, rose 2.8 points m/m in April to 49.7 – an 11-month high.
A combination of declining orders and rising inventories is a problem. Chart 1 subtracts inventories from orders, and the outcome is a new record – at least going back to January 1948. April’s reading of minus 22.6 is a new low.
Small-caps by nature are exposed to the domestic economy more than their large-cap cousins. So, when the Russell 2000 small cap index staged a major breakout early last week, bulls in general and small-cap bulls in particular were suddenly walking with a spring in their step.
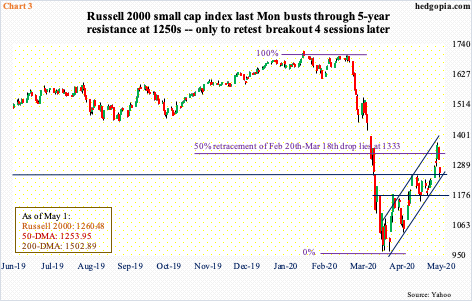
Going back five years, 1250s has been an important price point on the Russell 2000. After 960s was defended in three different sessions in the second half of March, the rally that followed stopped right at 1250s on April 9th. Bulls had to wait another couple of weeks before a breakout occurred last Monday. But this proved fleeting. By Wednesday, the index tagged 1373.39, which more than retraced 50 percent of the February-March collapse, which lies at 1333 (Chart 3).
By Friday, the index was back at retesting 1250s. A massive weekly shooting star formed as well. The intraday drop to 1241.91 was bought in that session, so the support is still intact, but runs a risk of a breakdown in the sessions ahead. Trough (March)-to-peak (April), the index (1260.48) rallied 42.1 percent intraday. That is a lot of gains for six weeks’ work. Longs will be increasingly tempted to lock profit in, especially if 1250s gives way. Immediately ahead, there is support at 1170s.
Potential weakness is also brewing in other caps.
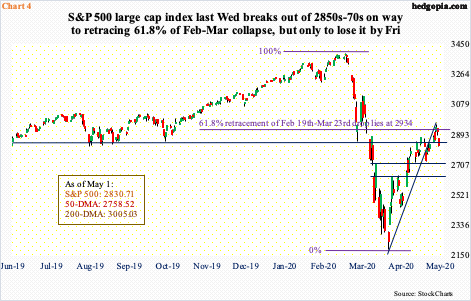
On April 21st, the S&P 500 large cap index lost a rising trend line from its March 23rd low, but bulls managed to defend short-term support at 2720s. It then rallied all along that broken trend line until it tagged 2954.86 intraday last Wednesday. By that time, not only did the index break out of horizontal resistance at 2850s-70s but also retraced 61.8 percent of the February-March collapse, which lies at 2934 (Chart 4).
As with the Russell 2000, the breakout did not last very long on the S&P 500. By Friday, the index (2830.71) was back below 2850s-70s, with a weekly shooting star. The daily in particular is extended. Odds favor it continues to unwind its overbought condition. Nearest support lies at the aforementioned 2720s, and 2630s after that.
Stocks have come a long way in a short period of time.
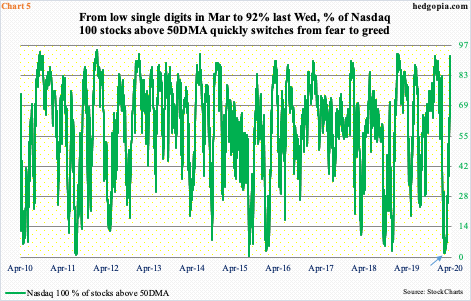
The S&P 500 rallied nearly 35 percent between its March 23rd low and April 29th high. At the lows, fear was pervasive, with the percent of S&P 500 stocks above the 50-day at one percent on March 12th and 1.2 percent on the 25th. This needed to unwind. Unwind it did – in quite a fashion. By last Wednesday, this metric stood at 76.2 percent.
Over on the Nasdaq 100 index, the same metric was two percent each on March 12th and 16th (arrow in Chart 5). Last Wednesday, 92 percent of the constituent stocks were above their 50-day. By the way, on February 19th when the rug was pulled from under stocks, this metric stood at 83 percent. It did not take long before extreme investor fear evident at the March lows to quickly give way to elevated optimism – again.
Elsewhere, investor sentiment is not quite as frothy, but at this point in time this can be interpreted as more of a negative than a positive.
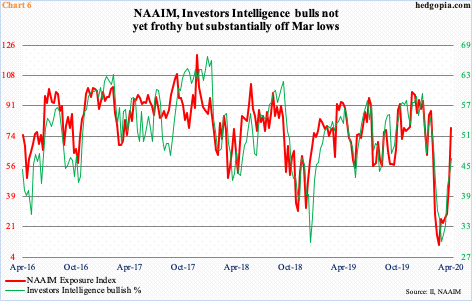
Last week, the NAAIM Exposure Index, which represents members’ average exposure to US equity markets, jumped 33.2 points week-over-week to 78.6 percent – a 10-week high (Chart 6). In the week to February 18th, the index read 87.9, and even hit 90s in December last year and January this year.
Investors Intelligence’s bullish percent, in the meantime, rose 3.3 percentage points w/w to 46.6 percent last week – a nine-week high. In January, bulls’ count had risen to as high as 59.4 percent and were 54.7 percent in the week to February 18th, when stocks were getting ready for the February-March crash.
From this perspective, both these metrics have room to rise before it gets effusive, but at the same time this can also be viewed this way. If a 35-percent rally in the S&P 500 in less than six weeks is not able to tempt on-the-sidelines money, what will?
Speaking of on-the-sidelines cash, it just keeps accumulating.
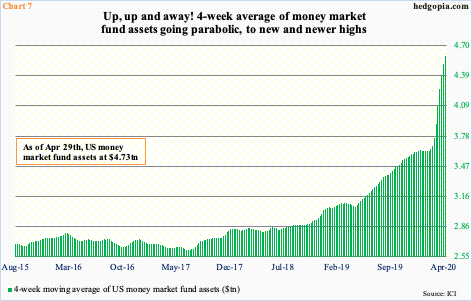
US money-market assets finished last Wednesday at $4.73 trillion – a new record. From the week to February 19th to last week’s total, these funds jumped $1.1 trillion. This includes a period when stocks were in a free fall, so it makes sense. The upward momentum, however, continued even after stocks bottomed. From the week to March 25th through last week, these funds rose $512.2 billion.
The four-week average in Chart 7 shows how parabolic the buildup has been in recent weeks. The March lows in stocks were not enough to entice this money. This includes Warren Buffett. Berkshire Hathaway (BRKA/B) reported its 1Q20 over the weekend. The company is sitting on more than $137 billion in cash – a record. The Oracle of Omaha obviously did not think the selloff in March was the right time to put this cash hoard into work.
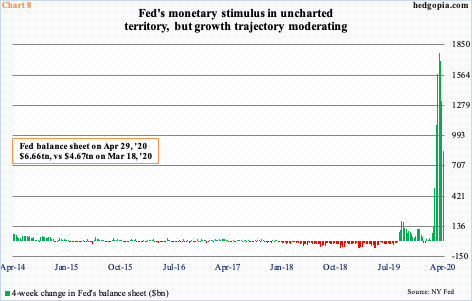
The Fed had a lot to do with the March-April surge in stocks. As a matter of fact, the S&P 500, and several other major equity indices, bottomed on March 23rd. On that very day, the Fed announced an open-ended quantitative easing (QE). This was preceded by a reduction of 150 basis points in the fed funds rate in two emergency meetings in March to a range of zero to 25 basis points and was followed by several other measures to provide monetary stimulus, including its decision to buy junk debt.
As a result, the balance sheet has gone vertical – from $4.31 trillion in the week to March 11th to $6.66 trillion last week – of course a new record.
Here is the thing. The balance sheet may be at a new record, but the pace of growth has decelerated. The bars on the right side of the skyscraper in Chart 8 are getting shorter. Investors loved it when the trajectory was up, now it is down. Markets that live or die by monetary morphine may have found a new reason to worry – just another reason for longs sitting on massive gains to ring up the cash register for now.
Thanks for reading!
