
There was a massive drop in money-market assets last week. This is a potential green shoot should this continue, although bulls could not quite cash in on it last week. The mother of all potential green shoots – foreigners – are still cutting back their exposure to US stocks.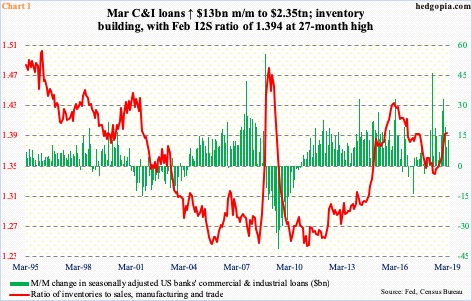
There are talks of green shoots in the economy. US retail sales in March jumped 1.6 percent month-over-month and 3.6 percent year-over-year to a seasonally adjusted annual rate of $514.1 billion. Last December, y/y growth had decelerated to 1.6 percent.
Similarly, February sales of existing and new homes jumped 11.8 percent and 4.9 percent m/m to 5.51 million units (SAAR) and 667,000 units (SAAR). Sales bottomed at 4.93 million in January and 552,000 last October, in that order.
But data continue to be mixed at best. At least going by the inventories-to-sales ratio in manufacturing and trade, inventory is building. The ratio bottomed last June at 1.339, rising to 1.394 by February – a 27-month high (Chart 1). In March, banks’ commercial & industrial loans rose $13 billion m/m to $2.35 trillion – a new record.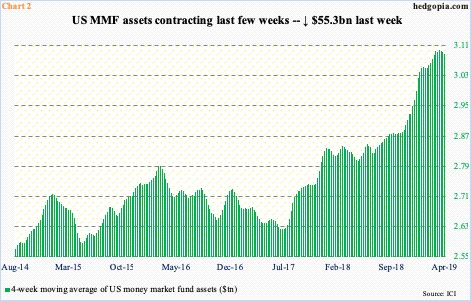
Concurrently in stocks, some green shoots as relates to fund flows appeared last week. Not that US stocks have done poorly of late. They have rallied big since late December. The S&P 500 large cap index is up 24 percent from that low. At the same time, flows lagged.
In the week through last Wednesday, SPY (SPDR S&P 500 ETF), VOO (Vanguard S&P 500 ETF) and IVV (iShares core S&P 500 ETF) gained a combined $7 billion. This followed inflows of $8.8 billion in the prior two weeks (courtesy of ETF.com). In the last couple of weeks, US-based equity funds took in $9.8 billion (courtesy of Lipper). That said, since stocks bottomed late December, these funds are still down $22.5 billion. Throughout this, money-market funds built up. From late December through the high of $3.11 trillion early March, they grew by $242.1 billion. It is only the last few weeks they have begun to contract, with a massive $55.3-billion drop last week to $3.04 trillion. For bulls, this is a green shoot. If the green bars in Chart 2 continue lower, the hope is that at least some of it makes its way into equities.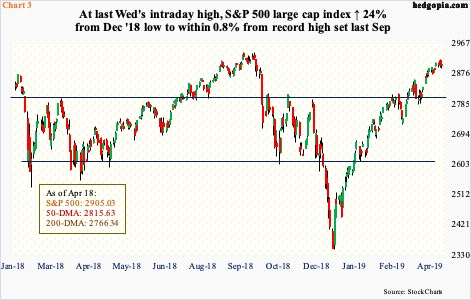
Although things did not quite turn out this way last week. Flows cooperated, but most major US indices failed to cash in. The Dow Industrials was up 0.6 percent and the Nasdaq composite 0.2 percent. The S&P 500 large cap index, on the other hand, inched down 0.1 percent. The S&P 400 mid cap index lost 0.6 percent and the S&P 600 small cap index 0.8 percent.
After massive rallies post-December lows, some subtle signs of fatigue were noticed last week. A weekly spinning top showed up on the Nasdaq composite; at Wednesday’s intraday high, it was merely one percent from the all-time high of 8133.3 set last August. On the S&P 500, a weekly doji was formed. On the daily, both the S&P 500 (Chart 3) and the Nasdaq composite last Friday saw a potential hanging man, even as the S&P 600 produced a doji just above the 50-day moving average. At Wednesday’s high, the S&P 500 was merely 0.8 percent from last September’s record high.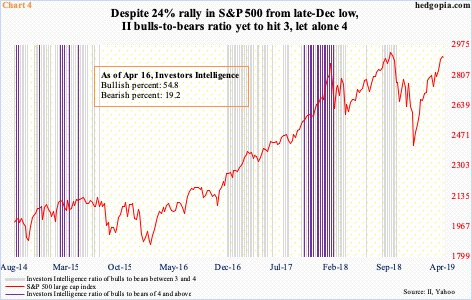
In ideal circumstances for bulls, more green shoots could come from investor sentiment data. Investors Intelligence bulls have risen from 29.9 percent from early January to last week’s 54.8 percent – a 27-week high. Early October last year, when stocks began what soon turned into a cliff-dive, bulls were 61.3 percent, for a bulls-to-bears ratio of 3.32. Currently, even after the massive jump in stocks since late December, the ratio is yet to print three, let alone four.
In other words, even though bulls have been in the 50 percent range for nine consecutive weeks, they have not reached giddy levels – at least judged by historical standards. Hence bulls’ hope that their ranks will continue to expand in the weeks ahead, pulling in more and more cash.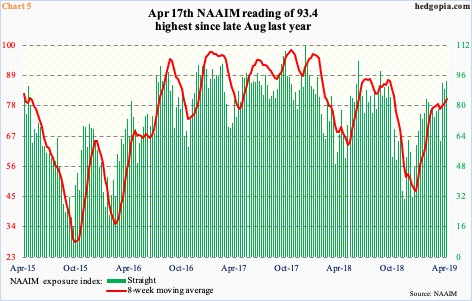
However, another measure of investor sentiment – the NAAIM exposure index – acts different. While Investors Intelligence is a survey-based measure of newsletter writers, the exposure index represents National Association of Active Investment Managers members’ average exposure to US equity markets. The latter jumped 4.5 points week-over-week last week to 93.4 – a 33-week high. Nineties – let alone north of 100 – are hard to sustain. The best-case scenario for bulls is a sideways move for several more weeks so other lagging measures, such as Investors Intelligence, begin to catch up.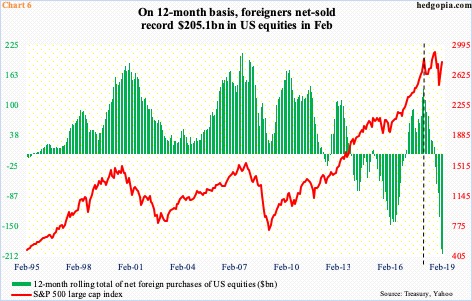
As things stand, Chart 6 is probably the mother of all potential green shoots. Foreigners have been avoiding US stocks for a while now. In January last year, the 12-month total of net foreign purchases of US equities peaked at $135.6 billion (vertical dashed line in Chart 6). That was also a month US stocks began a nasty, quick selloff. Stocks bottomed late February, but foreigners kept cutting back on their purchases. By September – also a month when the S&P 500 peaked – they were net-selling. Once again, the index bottomed late December, but foreigners kept selling. At $205.1 billion, February saw record 12-month selling.
This data series is published with a little lag. Since the end of February, the S&P 500 has rallied another 4.3 percent. We don’t know if foreigners have shifted their bias in the past month and a half. But once that happens, that should act as tailwind for stocks. At least that is what bulls are hoping for. Historically, there is a tight relationship between the S&P 500 and foreigners’ buying – or a lack thereof. Nonetheless, the two have diverged for over a year now. So at least in theory this divergence could continue when foreigners reduce net-selling – and even start net-buying – and stocks go the other way.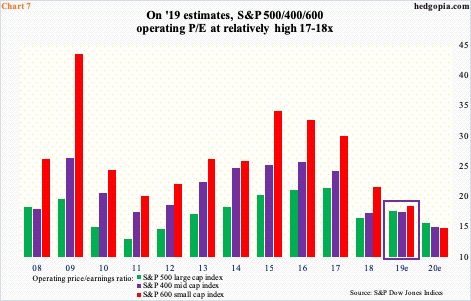
It is possible one of the reasons stopping foreigners from jumping on the bullish bandwagon is multiples, which are anything but cheap. Chart 7 plots the operating P/E for the S&P 500/400/600 companies. On ’19 estimates, they are respectively 17.6x, 17.4x and 18.5x. Thanks to rising stocks the past four months and persistent downward revision in earnings estimates, multiples have gradually risen. In January last year when foreigners began cutting back their purchases of US equities, the S&P 500 was selling at 16.6x.
As of last Thursday, ’19 estimates for S&P 500 companies were $165.03, down from $177.13 last August; S&P 400 estimates went from $124.32 last October to $112.22, and S&P 600 from $61.63 last June to $51.92. Using ’20 estimates, multiples shrink quite a bit – to 15x – but at this stage, particularly considering the prevailing downward revision trend, they cannot be taken seriously. In all likelihood, foreigners are not doing that either, hence their apathy toward US stocks.
If they are indeed waiting before multiples improve, this can only happen if (1) earnings estimates begin to rise – unlikely, and (2) the S&P 500 begins to sell off – likely.
Thanks for reading!
