- S&P 500 retraces 161.8 percent Fib extension of Oct 07-Mar 09 decline
- Transports not in sync with Dow/S&P 500, having broken several support levels
- Having spent lots of buying power of late, SPX shows signs of fatigue; pullback odds rising
Technicians and those technically inclined have waited with abated breath to see if the S&P 500 large cap index (2125.85) would hit 2138. That is the 161.8 percent Fibonacci extension of the October 2007-March 2009 decline. For Fibonacci followers, this is an important sequence. That level was hit yesterday. Well, almost. Post-FOMC minutes, the intra-day high yesterday was 2134.72. Now that the Fib target has been hit, what next?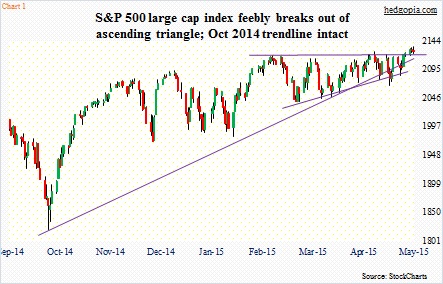
On the positive side of things, in order to get to ~2138 the S&P 500 needed to push through a three-month range – out of an ascending triangle. That took place last Friday, though ever so slightly. On Monday, the index further built on that mini-breakout (Chart 1). In ideal circumstances, this could mean a measured-move target of 2200.
The NYSE composite is in tow. The 11000 level has been a ceiling since July last year. The index has now conquered that resistance. Plus, the index never lost its October 2014 trendline. It came close several times, but was saved each time (Chart 2). Some other major indices were not as lucky. The Russell 2000 small cap index, for instance, lost that trendline in the last week of April.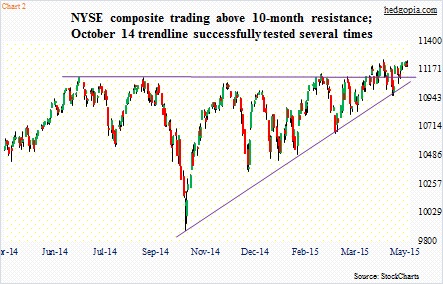
For nitpickers, when the S&P 500 nudged past the aforementioned resistance on Friday, it took place without much fanfare. Ditto with the further progress made on Monday. In fact, volume on Monday was lighter than in the previous two sessions. Not what you prefer to see in the midst of a breakout. On both Tuesday and Wednesday, the index nudged lower – essentially flat – and volume picked up.
What is going on here?
After a breakout, it is not at all surprising to see an index go sideways and try to digest the gains. It is normal.
What is not normal is what is happening elsewhere.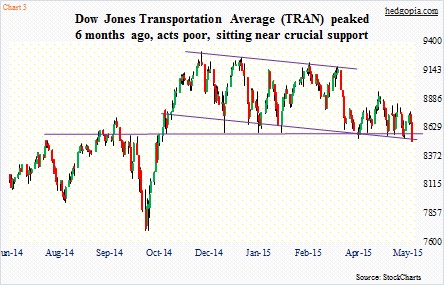
Forget the hit airline stocks took yesterday. Transports have refused to go along for the Dow Industrials/S&P 500 ride for six months now. The Dow Jones Transportation Average peaked toward the end of November last year and has traced out a lower-highs-lower-lows pattern. Yesterday, it fell out of that channel, though barely, so there is still time to retake that. It has, however, lost months-long horizontal support (Chart 3). The index is under both 50- and 200-day moving averages.
If industrials are doing just fine, but transports are struggling, markets are not in sync. Something is missing in the hunky-dory picture. Things are being produced but they are not being transported around because (1) there is not enough demand out there, and/or (2) shelves are full. Makes you wonder, is that why inventories have been rising?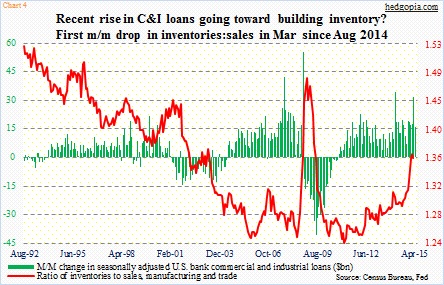
Chart 4 plots month-over-month change in U.S. commercial and industrial loans against the ratio of inventories to sales. For over a year now, the green bars have seen an uptick. But so has the red line, which has been rising since last August.
This weakness is not just limited to the transports. Utilities peaked in January. Both the Russell 2000 and the Nasdaq 100 are below their respective April highs. The shining light in all this is how financials are behaving. XLF (SPDR Financial ETF) on both Tuesday and Wednesday retreated a bit after testing late-December high of $25.05. On the other hand, KBE (SPDR S&P Bank ETF) broke out two weeks ago.
These financials must have expended a lot of buying power doing that. This also applies to the S&P 500. This is where it gets tricky.
Fund-flow news of late has been anything but positive. U.S. stock funds have seen $100 billion in redemptions this year. A Bank of America Merrill Lynch survey of global fund managers showed the other day that they only held 4.5 percent of assets in cash.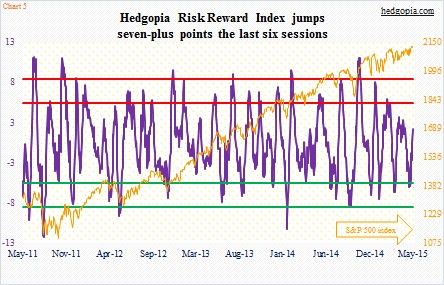
Yet the S&P 500 is hanging in there. But signs of fatigue are showing up, with dojis the last two sessions, raising odds of a pullback near-term. The Hedgopia Risk Reward Index still has room to move higher before getting to the red zone, but this thing has gained seven-plus points the last six sessions.
Levels to watch: SPX (2117, followed by 2095); RUT (1215); NDX (4480); NYA (11100); DOW (18200).
Thanks for reading.

