
Broader large-caps broke out to a new high last week responding to a dismal July jobs report and lower oil prices, even as small-caps seem poised for a breakout. But the tech-heavy Nasdaq 100 will need a solid week to even come close to its early-June peak.
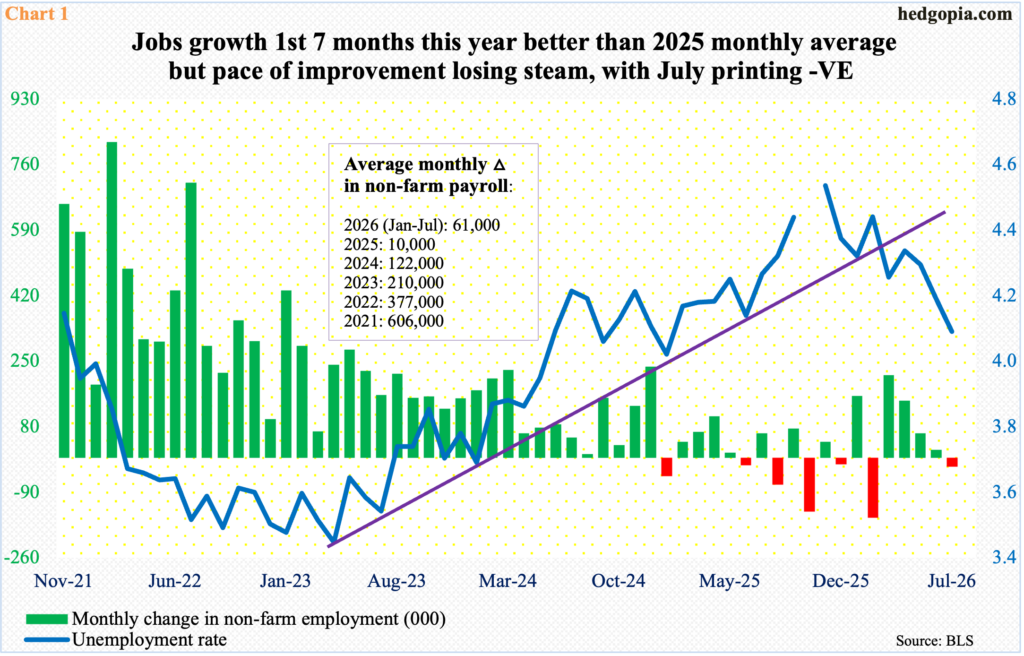
The labor market pulled quite a surprise in July – to the downside. Non-farm payroll was expected to go up by 83,000 last month, but it instead fell by 23,000; even worse, May and June were revised downward by a combined 103,000. Concurrently, the unemployment rate dropped to 4.09 percent – a year-and-a-half low – thanks to a slump in the labor force participation rate to the lowest since February 2021.
July’s is yet another datapoint showing a stalled job market. Since January last year, there have been seven monthly losses in jobs – out of 19 (Chart 1). March this year produced gains of 214,000, and job creation since has been on a downward trend. In 2025, the economy created a monthly average of 10,000 jobs; in the first seven months this year, this has improved to an average 61,000, but the trend is in deceleration.
Equities rallied big Friday, treating the dismal jobs report as sufficient to put the Federal Reserve on hold during the upcoming September (15-16) FOMC meeting. September rate-hike odds, which were 58 percent going into the report, immediately dropped to less than 40 percent (currently 44 percent).
The fed funds rate has been left unchanged at a rate of 3.5 percent to 3.75 percent since last December, with three dissents in the last meeting (July 28-29). July’s jobs report has taken a September hike off the table for now, but nothing is etched in stone just yet. Between now and the September meeting, three inflation reports are on dock – CPI for July (due on Wednesday this week) and August, and PCE for July – plus August’s jobs report.
For now, equity bulls are celebrating.
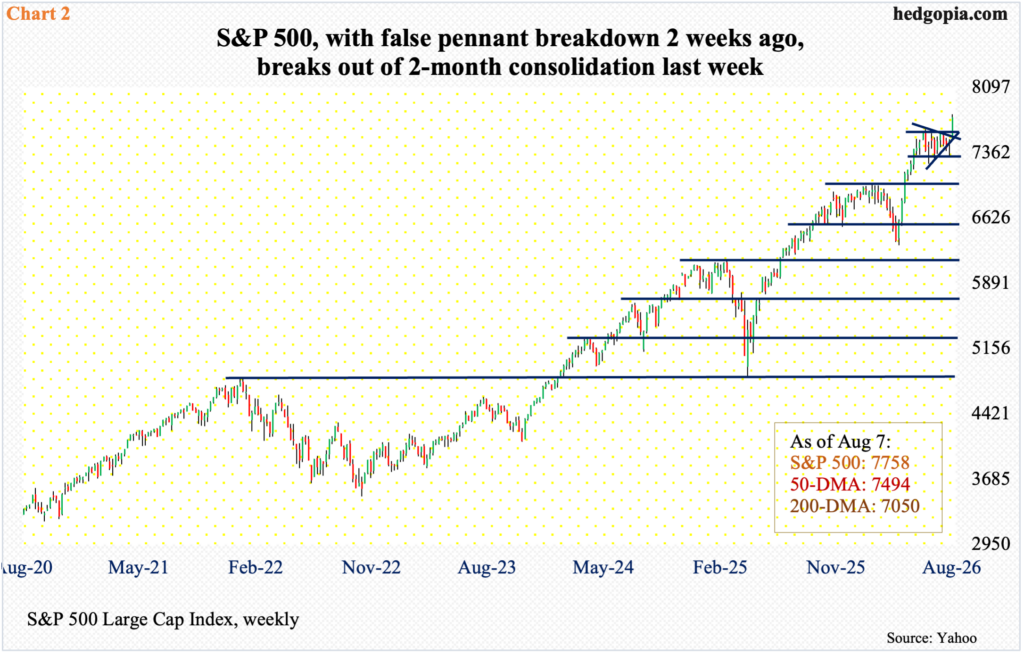
The S&P 500 broke out to a new high last week, jumping 3.6 percent to 7758. From the March 30 low 6317 to the June 2 high 7621, the large cap index shot up 20.6 percent before going sideways with support at 7300s.
Last week, the index bolted out of the two-month congestion. It turns out a pennant breakdown three weeks ago – although not decisive – was false (Chart 2). Bulls are now probably eyeing 7900-plus, which is arrived at using a measured-move approach; for that, they need to defend breakout retest at 7600 should weakness develop in the sessions ahead.
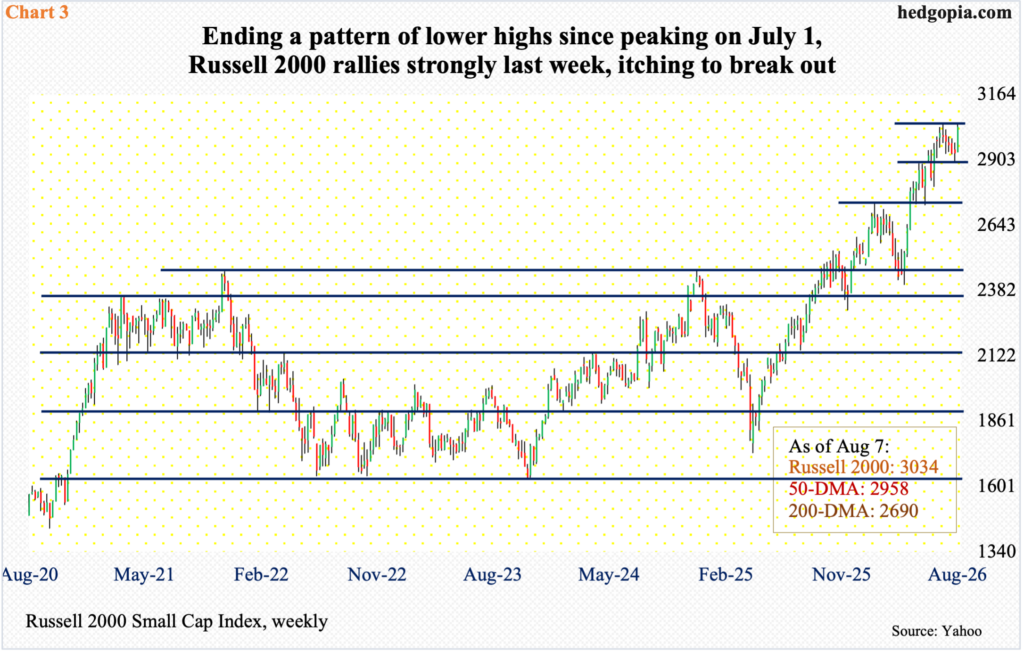
Unlike the large-caps, the Russell 2000 could not quite pull off a breakout to a new high last week, but the small cap index is darn close.
Last week, the Russell 2000 gained 3.5 percent to 3034, ending a four-week pattern of lower highs after the index peaked at 3047 on July 1; that intraday high was surpassed ever so slightly last Wednesday with a fresh high 3049, but the bulls failed to hang on to it.
As things stand, the index remains well poised to break out (Chart 3).
Small-caps’ performance last week is eyebrow-raising of sorts in that it came in a week in which the jobs picture meaningfully surprised on the downside. Small-caps by nature have a large exposure to the domestic economy versus their mid- to large-cap brethren which also have international exposure. But it is possible small-cap bulls focused more on rising prospects for no cut in September than on jobs. Plus, oil prices are behaving.
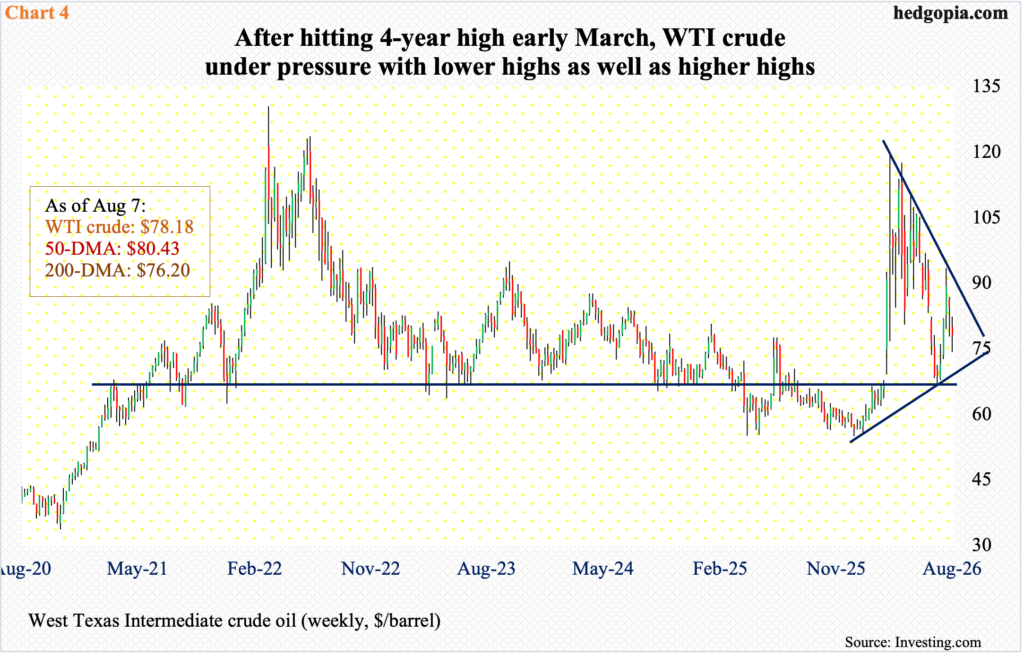
On March 2, West Texas Intermediate crude gapped up in reaction to the February 28 U.S. and Israeli military attack on Iran; by the 9th that month, the crude ticked a four-year high $119.48. On February 27, WTI closed at $67.02, with a session high $67.83 and a low $64.85.
Since the March 9 high, WTI has persistently made lower highs (Chart 4). Three weeks ago, on July 23, it tagged $93.50 to kiss the trendline resistance in question, and sellers were all over it. Last week, it gave back nine percent to $78.18/barrel – for a second down week in a row – trapped between the 50- and 200-day moving averages ($80.43 and $76.20 respectively).
With all the selling that has gone on in recent weeks, the crude remains oversold on the daily, so strength is possible in the near term; but should oil bulls fail to defend the 200-day, it does not take long before the low of early last month acts as a magnet.
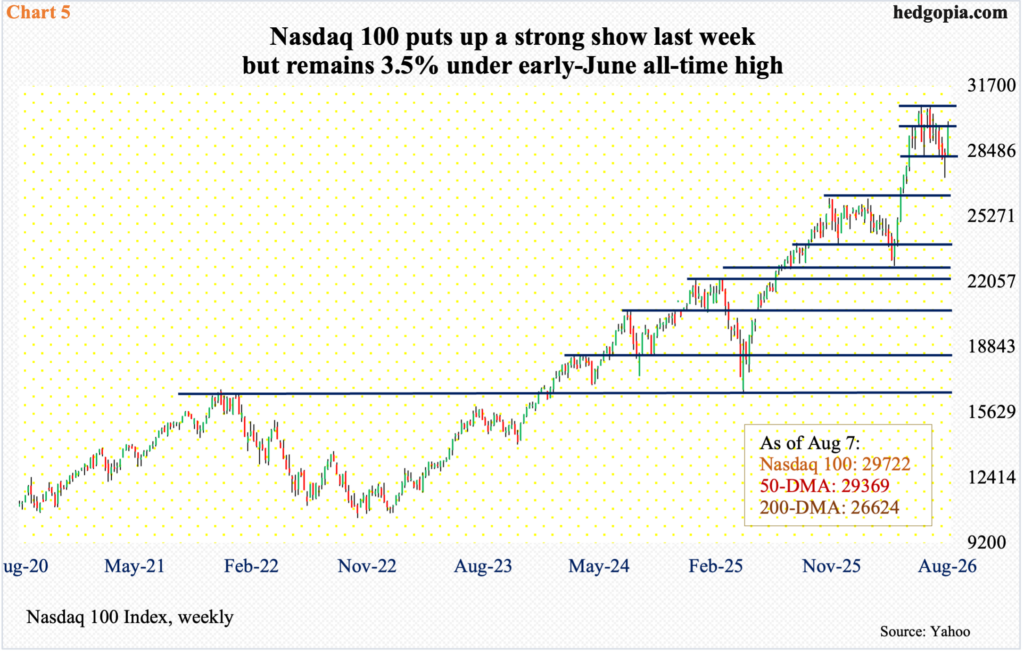
In the meantime, even as both large-caps in general and small-caps acted strong last week, tech is feeling left behind. Not last week, though. The Nasdaq 100 jumped 5.1 percent last week to 29722, but this was not enough to bring the tech-heavy index anywhere close to its June 3 peak of 30762 (Chart 5); from the March 30 low of 22841 through that peak, the Nasdaq 100 surged 34.7 percent. From that peak to the July 29 low of 27176, it then dropped 11.7 percent.
Bulls’ consolation is that last week’s action ended a series of lower highs since the June 3 peak, which the index needs to rally another 3.5 percent just to match, let alone surpass.
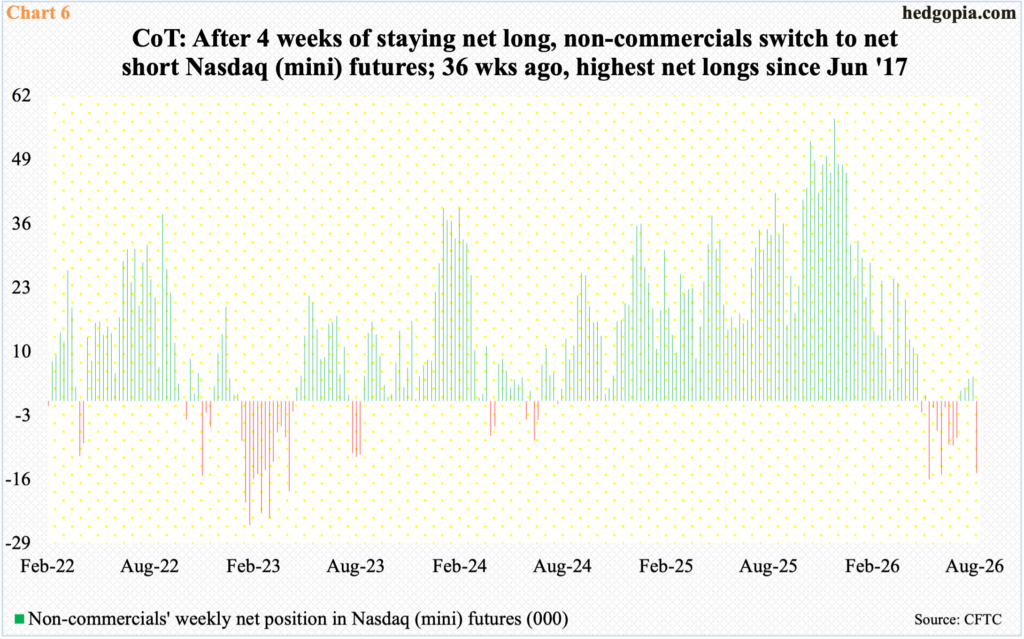
Non-commercials, as of last Tuesday, were behaving as if this prospect was going to have to wait for now. They switched to net short last week after remaining net long Nasdaq (mini) futures for four successive weeks (Chart 6).
To be clear, these traders can be wrong. They are not always right. The cash was mostly down during the four weeks when they were net long. And now that they are net short, the cash can always swing the other way, particularly if they are forced to cover. But given how the cash has been behaving of late, the benefit of the doubt should go to these traders.
Thanks for reading!
