
With five sessions to go in April, the Nasdaq 100 index (4474.19) is down 0.2 percent, while the Russell 2000 small cap index (1146.69) is up 2.9 percent. Last week made a big difference, as the former was down 1.5 percent, and the latter up 1.4 percent – for a 2.9-percent swing.
In normal circumstances, investors/traders gravitate toward these indices while they are in a risk-on mood. At present, small-caps are stealing the show.
Since the Feb 11th bottom through the intra-day high last Wednesday, the Russell 2000 is up nearly 22 percent, versus north of 15 percent on the Nasdaq 100. Even the S&P 500 outperformed the Nasdaq 100 by rallying nearly 17-percent during the period.
Things are beginning to diverge just a little bit.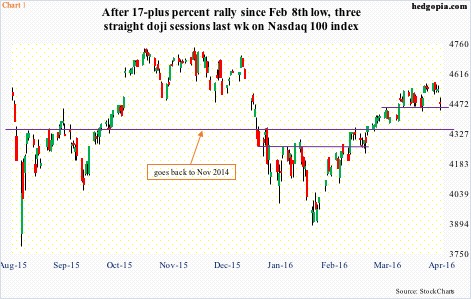
On the Nasdaq 100, three of the six sessions through Thursday last week produced dojis – essentially hugging the 10-day moving average. That got taken out Friday, reacting to disappointing earnings from Alphabet (GOOGL) and Microsoft (MSFT), among others; the session, down 1.5 percent, produced another long-legged doji (Chart 1).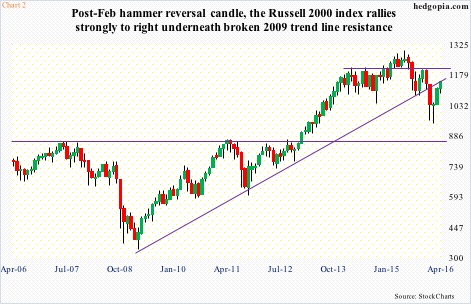
The Russell 2000, on the other hand, after taking out the 200-day moving average on Monday last week, is going sideways just underneath the upper Bollinger Band. The six-week, 22-percent surge has brought the index just underneath a rising trend line drawn from March 2009 (Chart 2). A decision time!
The S&P 500 is at a similar crossroads.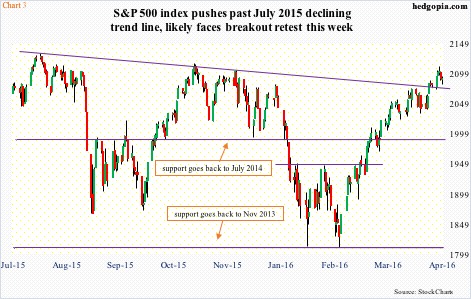
After an incessant 17-percent rally since February 11th and subsequent multiple breakouts, eight sessions ago it once again broke out of a July 2015 down trend line. Last Wednesday produced a spinning top just outside the upper Bollinger Band, followed by a filled candlestick on Thursday, and a hanging man on Friday. A breakout retest is likely this week.
Since the rally began, there have been several successful breakout retests on the S&P 500, as well as other indices. Will the July 2015 trend line hold this week? Better yet, will the S&P 500 go the route of the Russell 2000 or the Nasdaq 100 in the days/weeks to come?
Short squeeze has gone a long way in sustaining the momentum of the rally that began on February 11th.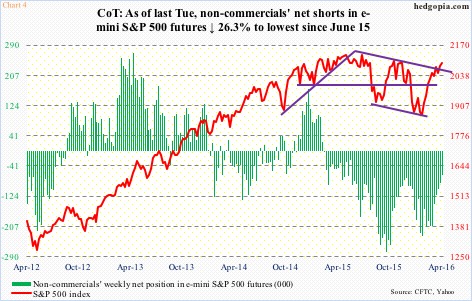
As of February 9th, non-commercials held 234,321 contracts in net shorts in e-mini S&P 500 futures. As of last Tuesday, holdings had shrunk to 65,938. That is a decline of 72 percent, eerily similar to the decline in net shorts between October 6th (278,179) and December 15th (75,348) last year – for a decline of 73 percent. The S&P 500 began to collapse in late December.
Non-commercials’ current net shorts are lower than in mid-December. Potential fuel for squeeze is running dry. Not an ideal scenario for stocks/indices that are in overbought territory. Take the ratio of VIX to VXV, for example.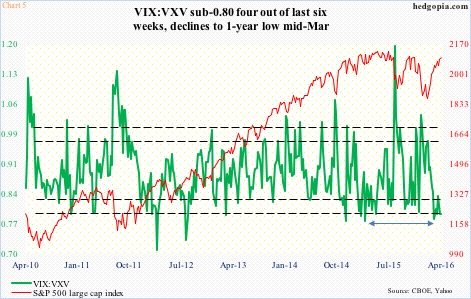
In four of the past six weeks, VIX:VXV has come in under 0.80, with the March 14th week producing a reading of 0.782 – a one-year low. The other two weeks are in the low 0.80s (Chart 5). This is too low a reading for too long a duration. (VIX uses options to measure implied volatility on the S&P 500 over the next 30-day period. VXV does the same but goes out three months.)
In the past, anytime the ratio has dropped this low, it eventually rises to the upper end of the range – sooner or later. And that brings bad news to stocks, as demand for shorter-term volatility goes up.
There is one scenario in which unwinding of the green line in Chart 5 may still take time to materialize. That is, if golden crosses live up to their name. Several major U.S. indices are on the verge of completing the formation.
On the S&P 500 (2091.58), a mere two points separate the 50- and 200-day moving averages. On the Nasdaq 100, the difference is 55 points; on the Russell 2000, 52 points; on the Dow Transports, 104 points, and on the NYSE composite, 162 points. The Dow Industrials already completed one last week.
Incidentally, the last time a golden cross developed on the S&P 500 was in late December last year – right before the January collapse in stocks. The success rate of crosses – be it golden or death – is not etched in stone. More often than not, by the time a golden cross appears, stocks would have moved already.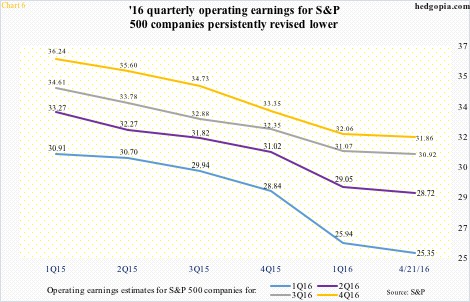
And they have, with the S&P 500 rallying nearly 17 percent in the past six weeks, ignoring weak macro data as well as deteriorating earnings. On the latter in particular, with 132 of S&P 500 companies reporting 1Q16 operating earnings (as of April 21st), 101 beat, 19 missed, and 12 met estimates. Yes, 23 percent either missed or only met.
This, despite the fact that 1Q16 – and for that matter this year’s other three quarters as well – estimates have persistently dropped since at least 1Q15. Back then, 1Q16 operating earnings estimates were $30.90, declining to $25.35 as of April 21st. The bar lowered enough for a decent percentage of companies to comfortably hurdle?
Probably, but there may not be enough non-commercial net shorts in e-mini S&P 500 futures left to continue to provide a squeeze tailwind for the index. Viewed this way, the imminent golden cross likely fails to live up to bulls’ expectations.
Thanks for reading!
