
Both large- and small-caps have failed to meaningfully build on their recent breakout. They were stopped at important spot and now risk breakout retest.
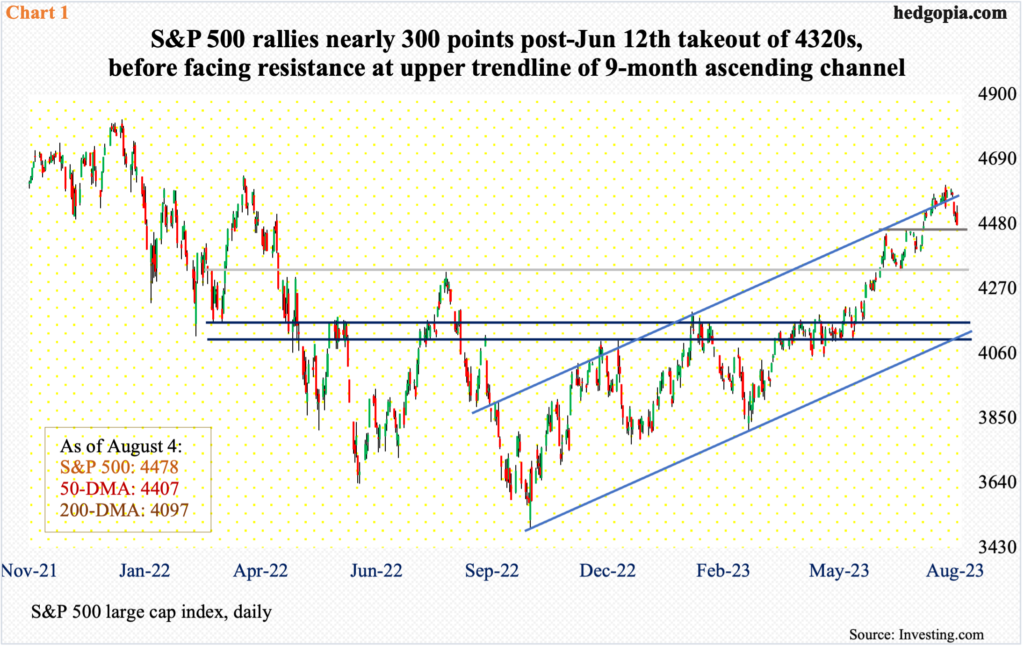
From last October’s low to the July 27th high of 4607, the S&P 500 shot up 31.9 percent. Along the way, it took care of one after another hurdle.
On June 12, for instance, the large cap index broke out of 4320s, which was a high from last August. This was an important breakout, and in no time nearly 300 points were added.
This also pushed several indicators such as the RSI into overbought territory. Bulls that were itching to lock in profit have an excuse to do so. The July 27th high was made in a session in which the index reversed hard to close at 4537 with a bearish engulfing candle.
Sellers appeared this week just north of trendline resistance of an ascending channel from last October’s low (Chart 1). After five consecutive up months, August acts wobbly off the blocks, down 2.4 percent. Last week, the index formed a red marubozu close, ending at 4478.
A breakout retest of 4320s probably lies ahead. There has already been a successful retest on June 26. This is a must-save for the bulls.
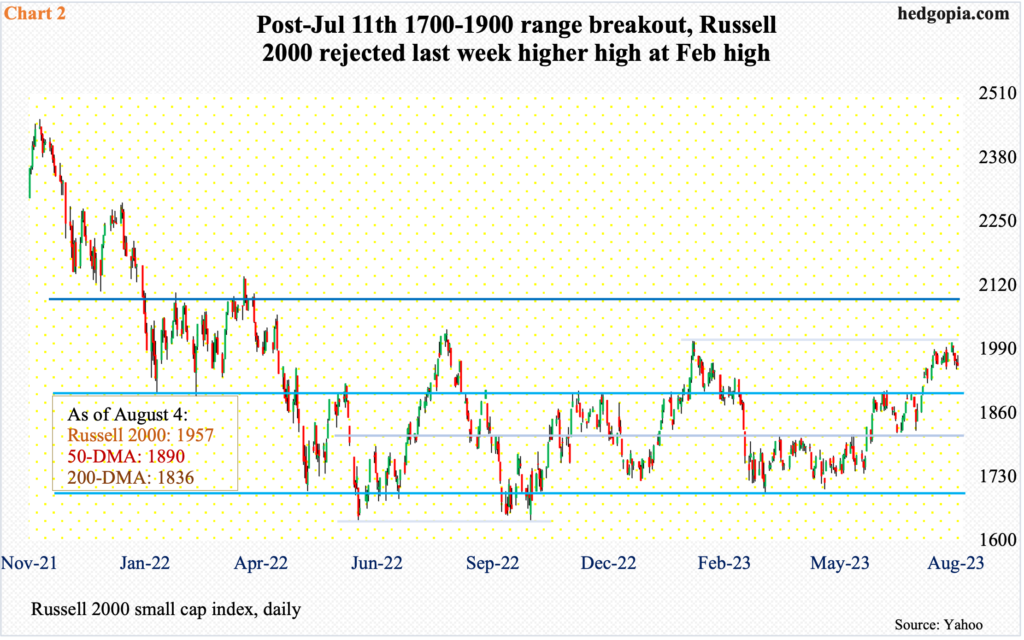
Small-cap bulls too are struggling to make the most of a crucial July 11th breakout. Until that date, the Russell 2000 was caught in a range of 1700 and 1900 for months – from January last year, to be specific (Chart 2).
Post-last month’s breakout, the small cap index did quickly add 100 points. Last Monday, it ticked 2004 before drawing offers. This occurred at a potentially important spot.
After 1900 was lost in May last year, the level was reclaimed twice – one in August and the other this January. Both proved fleeting, with lower highs in August and February – 2030 and 2007 respectively.
Ability to surpass the February high would have established a pattern of higher high – which would have come after a crucial range breakout. Now that the bulls have wasted an opportunity, a breakout retest at 1900 looks imminent. Last week, after Monday’s high, the index progressively closed lower, finishing at 1957.
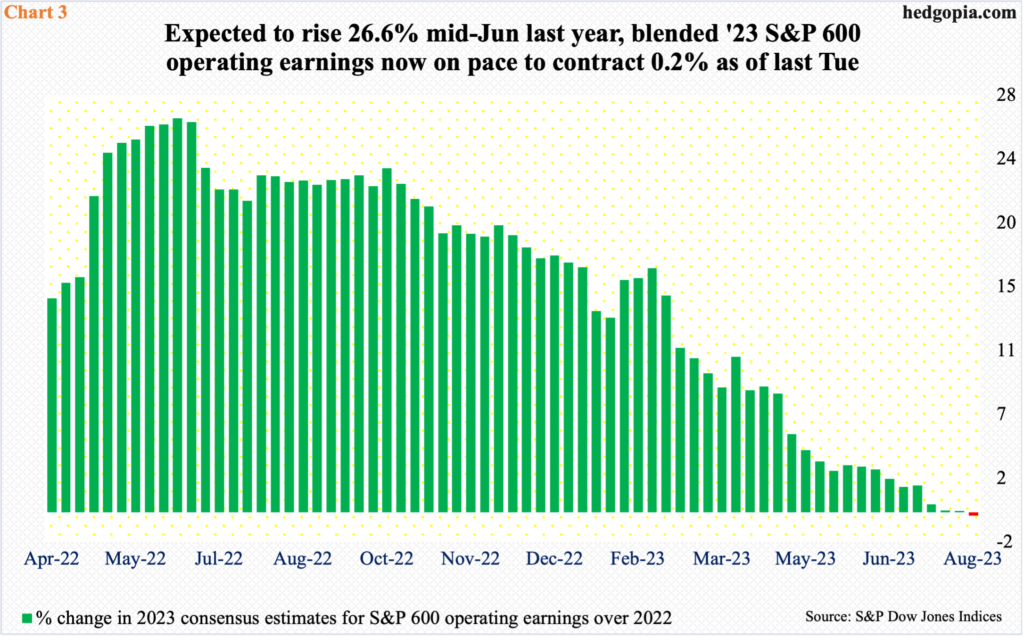
Russell 2000 bulls’ inability to surpass the February high coincides with a progressively deteriorating outlook for 2023 earnings.
As of last Tuesday, 2023 operating earnings for S&P 600 companies are now on track to drop 0.2 percent from 2022 (Chart 3).
At one time, 2023 earnings were expected to grow 26.6 percent, which was as of June 14th last year. Back then, 2022 consensus was at $87.89 and 2023 at $111.23; 2022 estimates were already on a downward trend from a peak of $92.70 as of April 12th last year, while 2023 peaked at $111.23 as of June 14th last year.
Estimates for both years kept going south. When it was all said and done, 2022 rang up $75.96. The revision trend for 2023 continued lower. At the end of last year, $92.67 was expected for this year. At the end of 1Q23, blended estimates were down to $82.37 and $77.67 at the end of 2Q23. With the earnings season more than three-fifths of the way through, 2Q blended estimates dropped to $75.79 last Tuesday – versus last year’s $75.96.
With a downtrend revision trend firmly in place, earnings are expected to surge 22.7 percent next year to $92.96, which not even an ardent bull perhaps believes is doable at this point. The sell-side habitually starts out optimistic and lowers numbers as the year progresses – evident in the way how 2022 and 2023 evolved.
Because they tend to have a large exposure to the domestic economy versus their mid- to large-cap cousins, small-caps a lot of times are treated as a measure to take the pulse of the economy. These stocks are hardly sending an optimistic message.
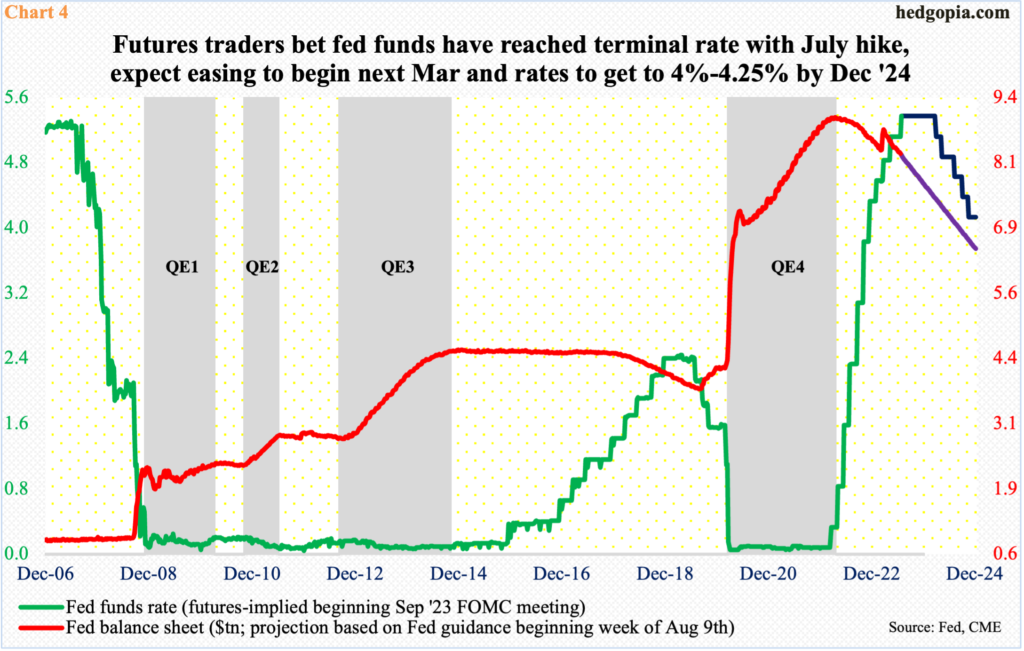
In this regard, small-caps and fed funds futures traders are on the same page.
The fed funds rate last month was raised by 25 basis points to a range of 525 basis points to 550 basis points, up from zero to 25 basis points in March last year. The message coming out of the Federal Reserve, which is also reducing its balance sheet by roughly $100 billion a month, is that at least one more hike is needed before ending the tightening cycle. In the futures market, traders, however, believe that a terminal rate has been reached and that the Fed would begin to ease by next March, ending 2024 between 400 basis points and 425 basis points. Even if we assume that the benchmark rates have peaked, these traders are betting on a cut of 125 basis points by the end of next year (Chart 4).
For this to come true, the economy needs to meaningfully decelerate, or even enter recession, the chances for which cannot be dismissed outright, although more and more economists and strategists of late have taken recession off their forecast.
July’s jobs report was the most recent example of a softening economy.
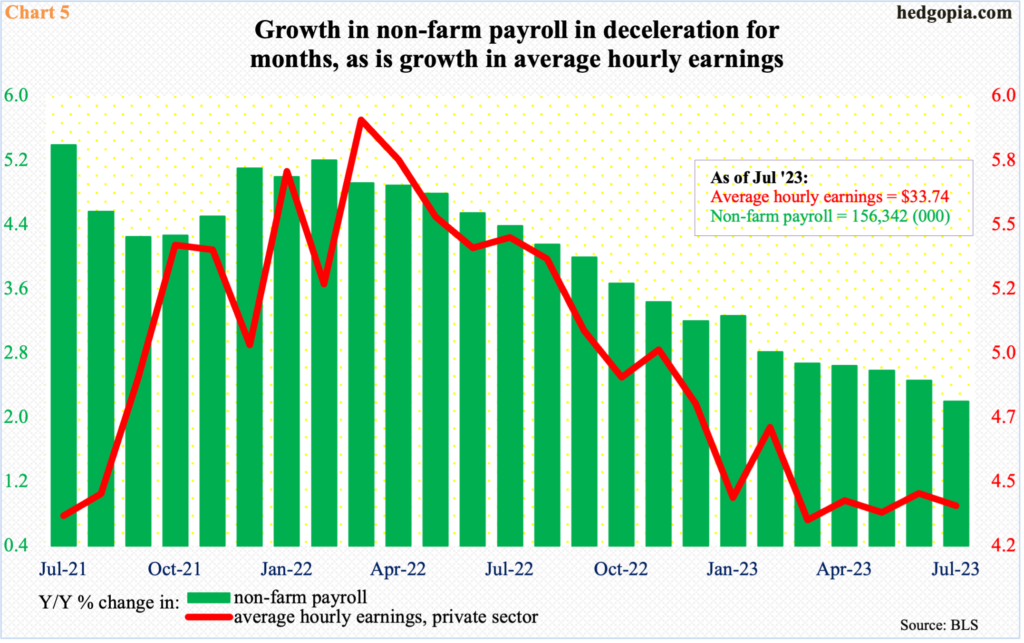
Last month, 187,000 non-farm jobs were added. This was a back-to-back sub-200,000 month, with June adding 185,000. With this, the first seven months this year has added an average 258,000 jobs, versus last year’s monthly average of 399,000.
The deceleration in job growth is also evident year-over-year. In July, non-farm payroll grew 2.2 percent from the corresponding period last year to 156.3 million. The green bars in Chart 5 have persistently dropped since February’s (2022) 5.2-percent clip. This is also the case with private-sector average hourly earnings, which grew 4.4 percent in July from a year ago, having peaked in March last year at 5.9 percent.
The question, therefore, in front of investors is ‘what if?’. What if small-caps are right in their rather pessimistic outlook for the economy? Rates have gone up by a decent amount over the past 17 months, and not all of the tightening has probably filtered through to the economy just yet. As this occurs, macro data should continue to weaken.
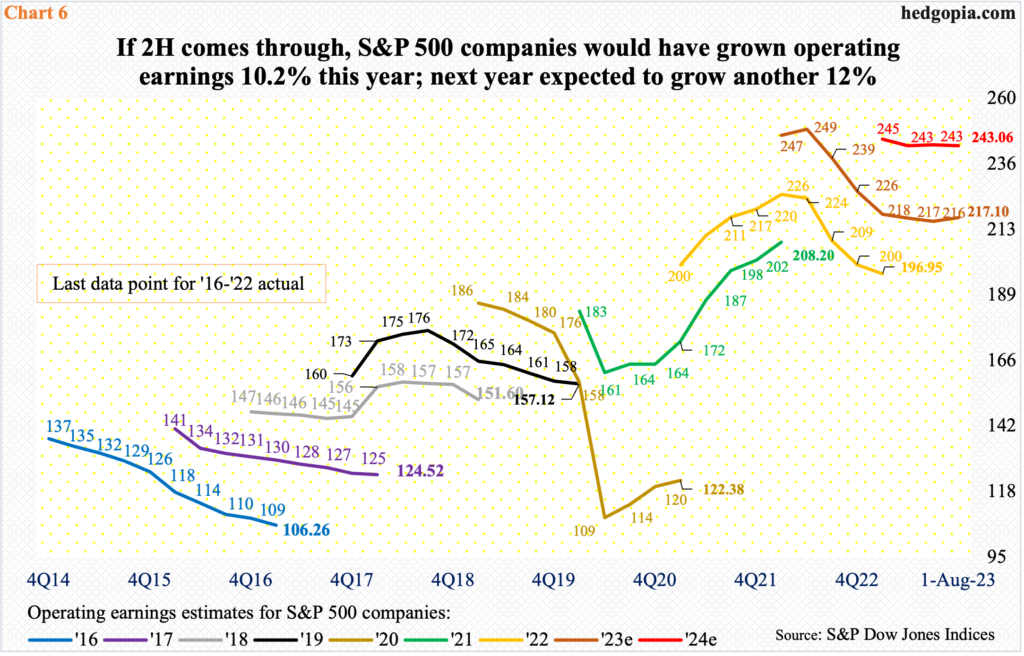
In this scenario, odds heavily favor the sell-side continues to revise its 2024 estimates for large-caps lower. As of last Tuesday, 64.2 percent of S&P 500 companies have reported their June quarter, bringing home $52.55 in operating earnings; when the quarter began, $53.78 was the consensus.
At the current pace, and should second-half estimates get realized, 2023 is on track for $217.10; in April last year, this was $250.12. Similarly, 2024 estimates are currently $243.06, versus a high of $246.31 this March. This would represent 12-percent growth over this year, which translates to acceleration from this year’s forecast growth of 10.2 percent – hard to swallow given the rise in interest rates, the decelerating trend in job creation and what small-caps are seeing.
Thanks for reading!
